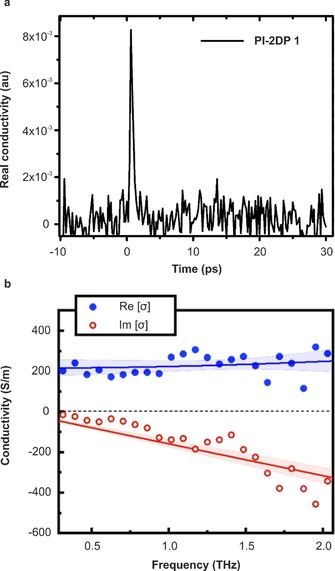
Figure 7.

a) THz characterization of PI‐2DP 1. The conductivity of PI‐2DP 1 as a function of the pump–probe delay (excitation wavelength, 400 nm, 90 μJ cm−2). b) Frequency‐resolved complex‐value of PI‐2DP 1 (1 ps after photoexcitation). Blue filled circles and transparent blue circles represent the measured real and imaginary components, respectively, and lines through the data points represent best fit obtained using the Drude–Smith model.
