Figure 2.

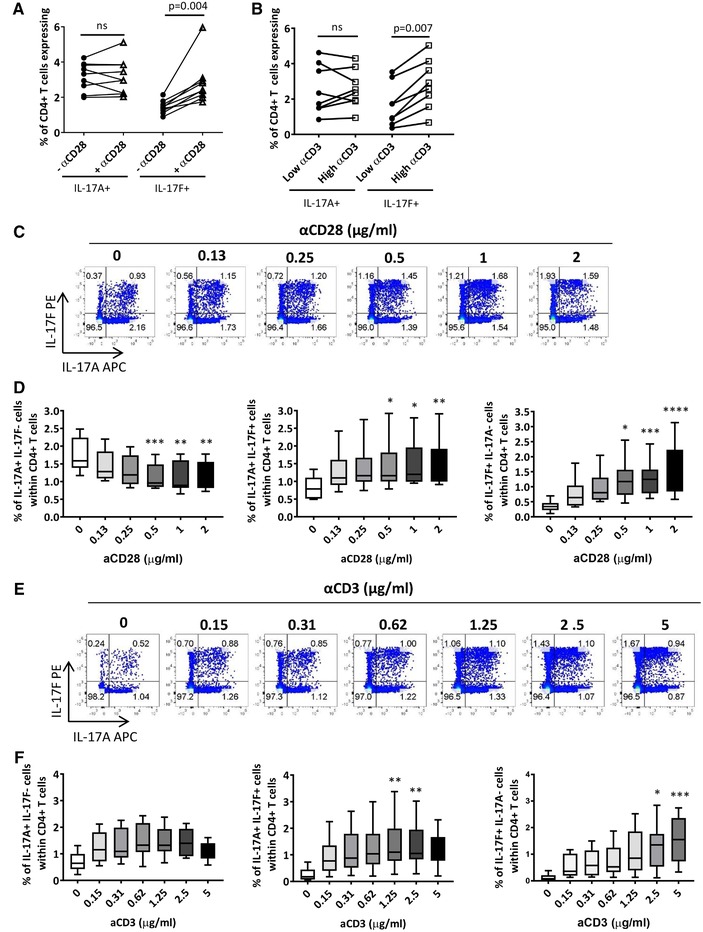
CD28 co‐stimulation and high‐dose anti‐CD3 mAb enhance induction of IL‐17F+ CD4+ T cells. (A) Bulk CD4+ T cells were cultured with anti‐CD3 mAb, IL‐23, and IL‐1β in the absence or presence of anti‐CD28 mAb (1 μg/mL). After 3 days, cells were re‐stimulated and assessed for IL‐17A and IL‐17F cytokine expression via flow cytometry. Results show the cumulative data for IL‐17A+ and IL‐17F+ CD4+ T cells (four independent experiments using n = 9 donors in total) analyzed using a Wilcoxon‐matched pairs test. (B) Bulk CD4+ T cells were cultured with anti‐CD28 mAb, IL‐23, and IL‐1β in the presence of low (0.15 μg/mL) or high (5 μg/mL) dose anti‐CD3 mAb for 3 days and then re‐stimulated. Results show the cumulative flow cytometric data for IL‐17A+ and IL‐17F+ CD4+ T cells (three independent experiments using n = 8 donors in total) analyzed using a Wilcoxon‐matched pairs test. Bulk CD4+ T cells were cultured with (C and D) anti‐CD3 mAb, IL‐23, and IL‐1β in the presence of increasing doses of anti‐CD28 mAb (0–2 μg/ml) or (E and F) anti‐CD28 mAb, IL‐23, and IL‐1β in the presence of increasing doses of plate‐bound anti‐CD3 mAb (0–5 μg/mL). After 3 days, cells were re‐stimulated and assessed for IL‐17A and IL‐17F cytokine expression. (C and E) Representative dot plots show the percentages of IL‐17A+IL‐17F−, IL‐17A+IL‐17F+, and IL‐17F+IL‐17A− cells within CD4+ T cells and (D and F) box whisker plots represent cumulative data from (D) three independent experiments using n = 6 donors in total and (F) three independent experiments using n = 8 donors in total. Data are shown as the mean ± SEM. Statistical analysis was performed using Friedman test with comparison to control (0 μg/mL for anti‐CD28 mAb and 0.15 μg/mL for anti‐CD3 by Dunn's Multiple Comparisons test. *P < 0.05, **P < 0.01, ***P < 0.001, ****P < 0.0001.
