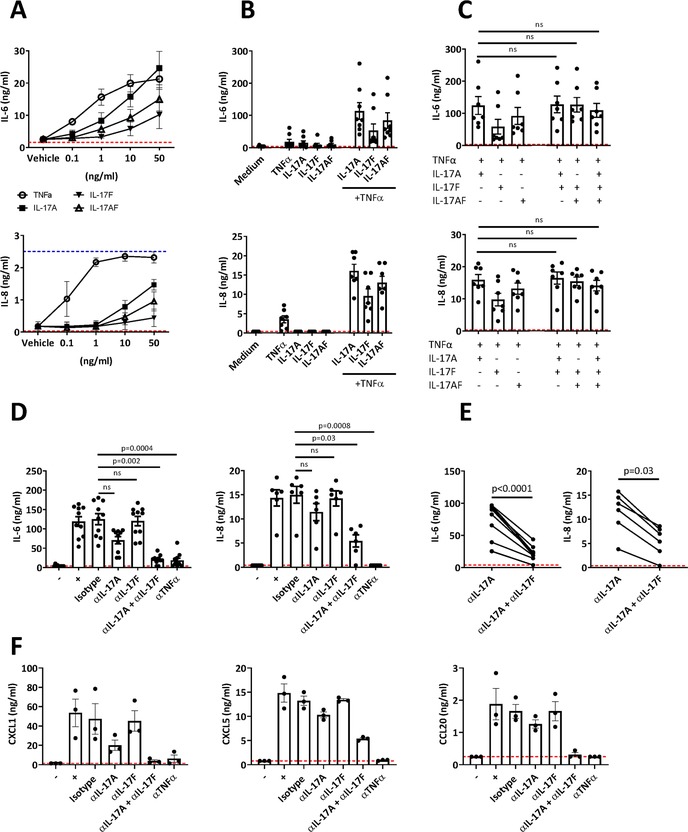
Figure 4.

Investigating the effect of IL‐17A and IL‐17F addition versus blockade on synovial fibroblasts. (A) Synovial fibroblasts were cultured with indicated concentrations of IL‐17A, IL‐17F, and TNF‐α. The levels of IL‐6 and IL‐8 present in the fibroblast supernatant were measured by ELISA (cumulative data from four independent experiments using in total n = 3 RA fibroblasts and n = 1 PsA fibroblasts). Data are shown as the mean ± SEM. (B and C) Combinations of the above cytokines (IL‐17 cytokines at 10 ng/mL and TNF‐α at 1 ng/mL) were added to synovial fibroblasts. After 24 h incubation, supernatants were collected and IL‐6 (cumulative data from six independent experiments using in total n = 3 RA fibroblasts and n = 5 PsA fibroblasts) and IL‐8 (cumulative data from five independent experiments using in total n = 2 RA fibroblasts and n = 5 PsA fibroblasts) secretion levels were measured by ELISA. Bars show mean ± SEM of results. Statistical analysis was performed using Friedman test with comparison to IL‐17A and TNF‐α by Dunn's Multiple Comparisons test. (D–F) Synovial fibroblasts were cultured with a cocktail of human recombinant IL‐17A, IL‐17F, IL‐17AF, and TNF‐α (all at 10 ng/mL) in the absence or presence of the indicated neutralizing antibodies (1 μg/mL). After 24 h incubation, supernatants were collected and IL‐6 (cumulative data from 10 independent experiments using in total n = 4 RA fibroblasts and n = 6 PsA fibroblasts) and IL‐8 (cumulative data from four independent experiments using in total n = 3 RA fibroblasts and n = 3 PsA fibroblasts) secretion levels were measured by ELISA. In general, two different RA and PsA cell lines were used in each experiment. (D) Bars show mean ± SEM of results. Statistical analysis was performed using Friedman test with comparison to isotype by Dunn's Multiple Comparisons test. (E) Analysis of IL‐6 and IL‐8 protein levels conditioned either with αIL‐17A or αIL‐17A + αIL‐17F using a Wilcoxon‐matched pairs test. (F) Synovial fibroblast supernatants (one independent experiment using n = 2 PsA fibroblasts and n = 1 RA fibroblasts) were analyzed for levels of CXCL1, CXCL5, and CCL20 via Luminex. Bars show mean ± SEM of results. Dashed red and blue lines indicate lower and upper ELISA detection limits, respectively.
