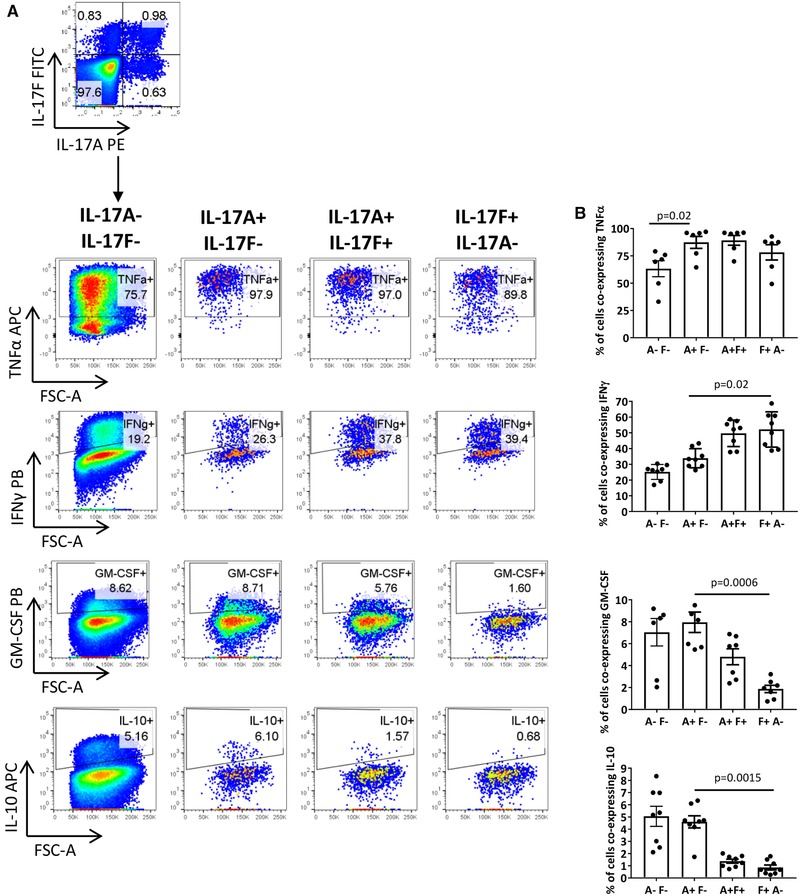
Figure 5.

IL‐17F+IL‐17A− and IL‐17A+IL‐17F+ CD4+ T cells display a different cytokine profile in comparison to IL‐17A+IL‐17F− CD4+ T cells. Bulk CD4+ T cells were cultured with anti‐CD3 mAb, anti‐CD28 mAb, IL‐23, and IL‐1β. After 3 days, cells were re‐stimulated and assessed for intracellular cytokine expression by flow cytometry. (A) Representative dot plot of IL‐17A+ and IL‐17F+ CD4+ T cell populations. Following gating within IL‐17A−IL‐17F−, IL‐17A+IL‐17F, IL‐17A+IL‐17F+, and IL‐17F+IL‐17A− CD4+ T cells, the co‐expression of other cytokines was analyzed. (B) Cumulative data showing the percentage of each population co‐expressing TNF‐α (four independent experiments using n = 6 donors in total), IFN‐γ (five independent experiments using n = 8 donors in total), GM‐CSF (three independent experiments using n = 7 donors in total), or IL‐10 (six independent experiments using n = 8 donors in total). Bars represent the mean ± SEM. Statistical analysis was performed using Friedman test with comparison to IL‐17A+IL‐17F− CD4+ T cells by Dunn's Multiple Comparisons test.
