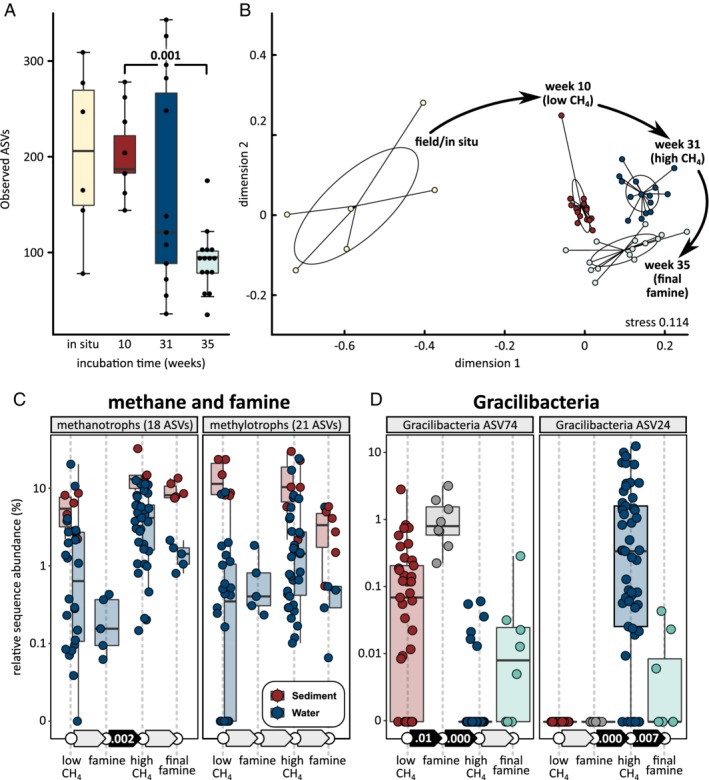
Figure 5.

Changes of microbial community structure with incubation time.
A, Sediment community richness decreased during the incubations.
B, Nonmetric multidimensional scaling plot showing sediment communities displayed similar turnover across all experiments, independent of oxygen, methane or nitrate availability (Anosim R 0.68, significance 0.001). Note that panels A and B include the control, which received no methane, oxygen or nitrate.
C, Relative sequence abundance of methanotrophs increased during high methane supply. The absence of methane (famine) periods did not lead to significant decline of methanotrophs. Changes in the abundance of other methylotrophs were not significant.
D, Succession of two different Gracilibacteria (Candidate Phyla Radiation) populations, observed in the water (suspended cell) community. Significant differences (Kruskal‐Wallis rank sum test) between sequential time periods in C and D shown by solid black arrows with P values. Each dot represents one sample. [Color figure can be viewed at http://wileyonlinelibrary.com]
