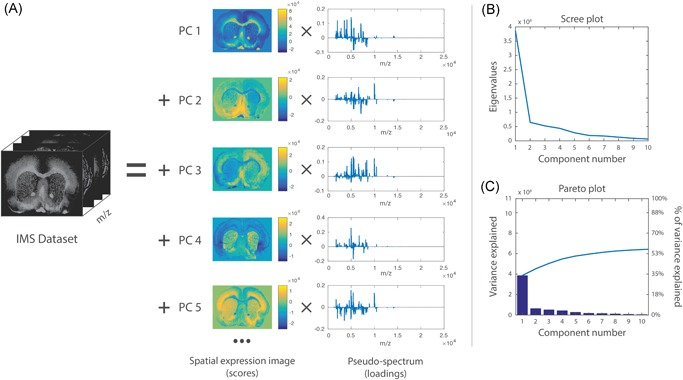
Figure 2.

Example of PCA. PCA applied to a MALDI IMS dataset acquired from a coronal rat brain section of a Parkinson's disease model. Details of the dataset are available in Verbeeck et al., 2017. (a) PCA decomposes the original IMS dataset into a sum of principal components (PCs), where each component is characterized by a spatial expression image (score) times a pseudospectrum (loading). The PCs are ranked by the amount of variance they account for in the original dataset. The first five PCs are displayed, showing extraction of molecular patterns specific to various anatomical structures and with some exhibiting clear differences between the left and right hemispheres (as expected in this disease model). To estimate the number of relevant principal components for a dataset, a scree plot (b) or Pareto plot (c) can be used. These visualize the variance explained per PC, and can thus suggest a cut‐off threshold. IMS, imaging mass spectrometry; MALDI, matrix‐assisted laser desorption/ionization; PCA, principal component analysis. [Color figure can be viewed at wileyonlinelibrary.com]
