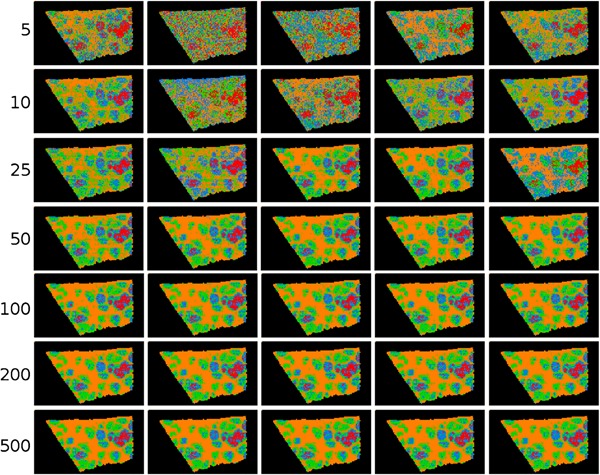
Figure 4.

Example of ‐means clustering performed on random projections. Original caption: Top‐to‐bottom: increasing the number of projections up to around 100 increases the segmentation reproducibility; after this point, the segmentation result completely stabilizes and the same tissue patterns are produced. Left‐to‐right: each column is the result of a different set of random vectors. At low numbers of projections, the exact choice of projection vectors affects the results of the segmentation, whereas for higher numbers of projections, the segmentation is stable and reproducible against a different choice of projection vectors. Source: Reproduced from Palmer et al. (2015), Figure 4, under Creative Commons Attribution License. [Color figure can be viewed at wileyonlinelibrary.com]
