
Figure 5.
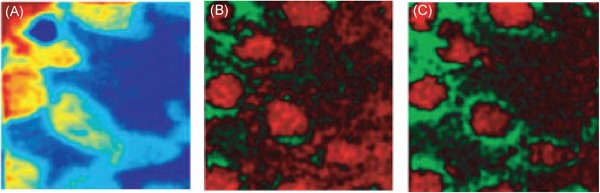
A comparison of PCA and MAF results. Original caption: Scaled, smoothed images of HeLa cells showing (a) the total ion image; (b) PC 6; and (c) MAF 4. MAF captures the distinction between inner and outer cellular regions more clearly than PCA. Comparison with the total ion image shows the additional information available following multivariate analysis. Source: Henderson et al. (2009), Figure 3, reproduced with permission from John Wiley & Sons. MAF, maximum autocorrelation factorization; PCA, principal component analysis. [Color figure can be viewed at wileyonlinelibrary.com]