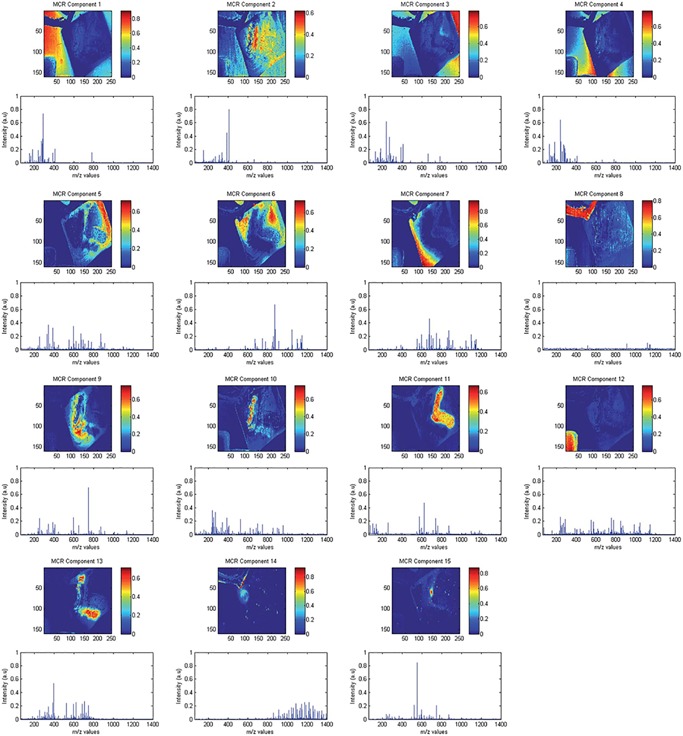
Figure 6.

Example of MCR‐ALS applied in NIMS data. Original caption: MCR‐ALS results of the microbe dataset. Distribution maps after refolding and MS spectra of all resolved components. Source: Jaumot & Tauler (2015), Figure 2. Adapted with permission of the Royal Society of Chemistry. MCR‐ALS, multivariate curve resolution by alternating least squares; NIMS, nanostructure‐initiator mass spectrometry. [Color figure can be viewed at wileyonlinelibrary.com]
