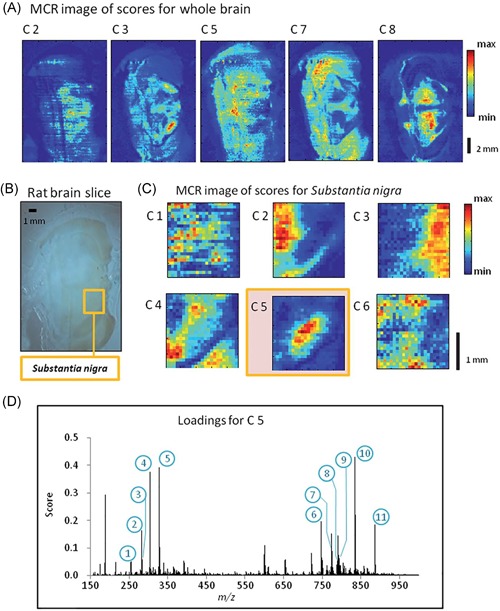
Figure 7.

Example of MCR applied in DESI data. Original caption: Progressive MCR analysis of rat brain slice. (a) MCR analysis of the entire image with 8 components. MCR components 2, 3, 5, 7, and 8 show the presence of distinct brain structures. (b) Optical image of original brain slice showing the location of the substantia nigra. (c) MCR analysis of the substantia nigra part of the image with 6 components. Component 5 picks out the brain region clearly. (d) Plot of the loadings scores for component 5 from the MCR analysis of the image for the substantia nigra region. The 11 numbers refer to tentatively identified peaks, which are presented in table 1. Source: Rao et al. (2012), Figure 7. Reproduced with permission of the Royal Society of Chemistry. DESI, desorption electrospray ionization; MCR, multivariate curve resolution. [Color figure can be viewed at wileyonlinelibrary.com]
