Figure 8.

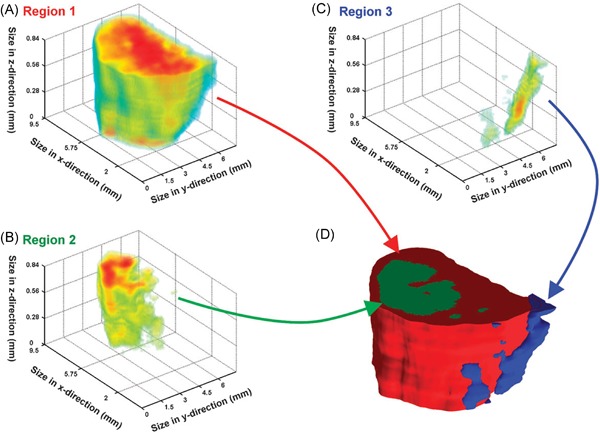
Example of NMF applied to NIMS data. Original caption: Multivariate analysis of the 3D tumor model. Non‐negative matrix factorization (NMF) was used to identify regions within the 3D dataset. (a) The 3D volume defined by component 1/region 1 represents the bulk of the tumor. (b) Component 11/region 2 lies within the interior of the tumor. (c) A region along the edge of the tumor was identified by component 15/region 3. (c) The 3D intensity data for each region can be used to create a 3D space‐filling model, where each color represents a different region within the dataset (region 1: red; region 2: green; region 3: blue). Source: Reindl et al., 2011, Figure 3. Reproduced with permission of the Royal Society of Chemistry. NIMS, nanostructure‐initiator mass spectrometry; NMF, nonnegative matrix factorization. [Color figure can be viewed at wileyonlinelibrary.com]
