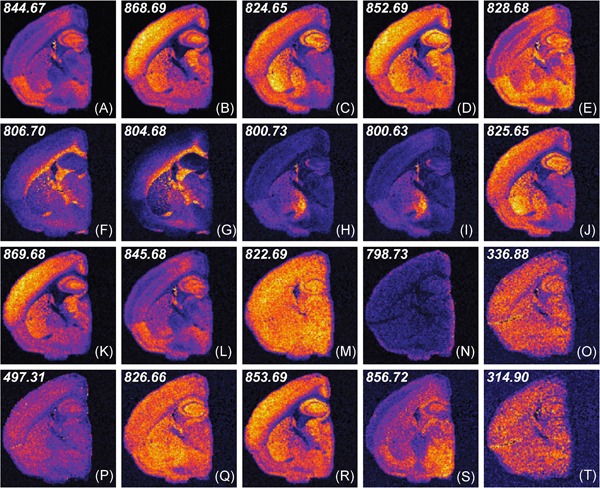
Figure 10.

Example of CX/CUR decomposition applied to NIMS data. Original caption: Ion‐intensity visualization of the 20 most important ions selected via deterministic decomposition with and on brain dataset. The distribution of leverage scores is presented in figure 2B [in original paper]. Some of these ions map to distinct regions in the brain. Particular regions of the cortex, pons, and corpus collosum stand out as distinct anatomically identifiable regions. Also in the list are likely background ions and contaminants from the embedding material. Of the 20 ions, little redundancy is present, pointing to the effectiveness of the approach for information prioritization. Source: Reprinted with permission from Yang et al. (2015), Figure 3. Copyright 2015 American Chemical Society. NIMS, nanostructure‐initiator mass spectrometry. [Color figure can be viewed at wileyonlinelibrary.com]
