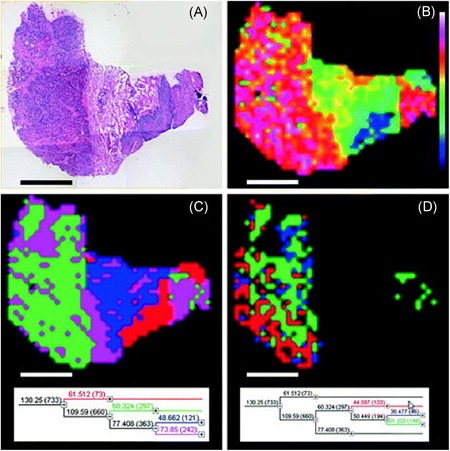
Figure 11.

Example of PCA and HC in MALDI IMS data. Original caption: PCA and hierarchical clustering for a gastric cancer section. (a) H&E‐stained tissue section after MALDI imaging measurement. (b) Scores of the first principal component show the hot colors in the tumor area. (c) Hierarchical clustering: Top dendrogram nodes differentiate tumor (green and magenta) versus nontumor (blue, squamous epithelium in red). (d) The dendrogram can be expanded down the tumor node to evaluate the molecular differentiation inside the tumor. This can also be directly correlated with the histology. This workflow enables the fast and concise selection of mass spectra representative for specific tissue states. Scale bar: 2 mm. Source: Deininger et al., 2010, Figure 22.2. Reproduced with permission from Springer. IMS, imaging mass spectrometry; MALDI, matrix‐assisted laser desorption/ionization; PCA, principal component analysis. [Color figure can be viewed at wileyonlinelibrary.com]
