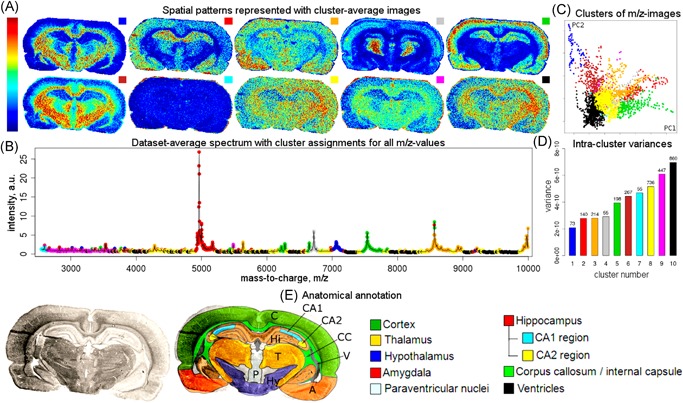
Figure 12.

Example of clustering of ion images. Original caption: Results of the analysis of a MALDI imaging mass spectrometry dataset of a rat brain coronal section, following the proposed approach based on clustering images into 10 clusters according to their spatial similarity. (a) Cluster‐average images represent detected spatial patterns. (b) Data‐set‐average spectrum with assignments of values to the clusters; for detailed cluster assignments of all values, see Table S2 [in original paper] of the Supporting Information. (c) Visualization of images in the space of their two first principal components; one dot represents an image, and dots are colored according to their cluster assignments. (d) Intracluster variances, where the numbers on the top of bars represent the cluster sizes. (e) Optical image of the section with anatomical annotation provided. Plots A‐B show the variety of the spatial patterns among images and help understand how each image looks. Plots c and d help evaluate the clustering. For results for 5, 15, and 20 clusters, see Figures S3, S4, and S5 [in original paper] of the Supporting Information. Source: Reprinted with permission from Alexandrov et al., 2013b, Figure 1. Copyright 2013 American Chemical Society. MALDI, matrix‐assisted laser desorption/ionization. [Color figure can be viewed at wileyonlinelibrary.com]
