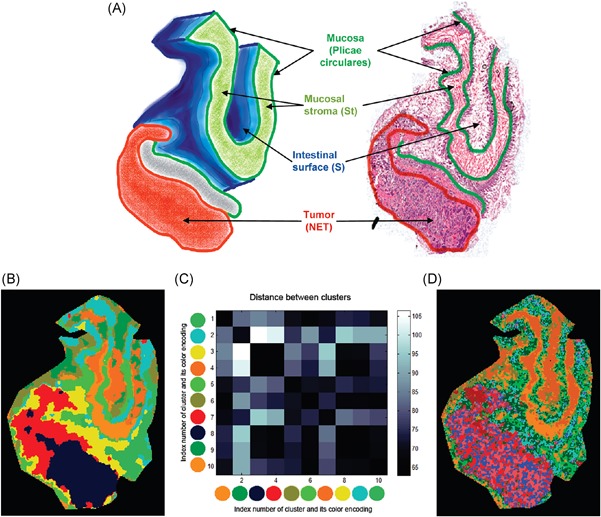
Figure 13.

Example of incorporation of spatial information in clustering of MALDI data. Original caption: The human neuroendocrine tumor dataset. (a) 3D‐structure of the tissue used for MALDI‐imaging measurement and optical image of the H&E stained section with main functional structures. (b) Segmentation map, strong denoising, 10 clusters. (c) The matrix showing distances between clusters for panel B. (d) Segmentation map, weak denoising, 10 clusters. Source: Reprinted with permission from Alexandrov et al., 2010, Figure 10. Copyright 2010 American Chemical Society. MALDI, matrix‐assisted laser desorption/ionization. [Color figure can be viewed at wileyonlinelibrary.com]
