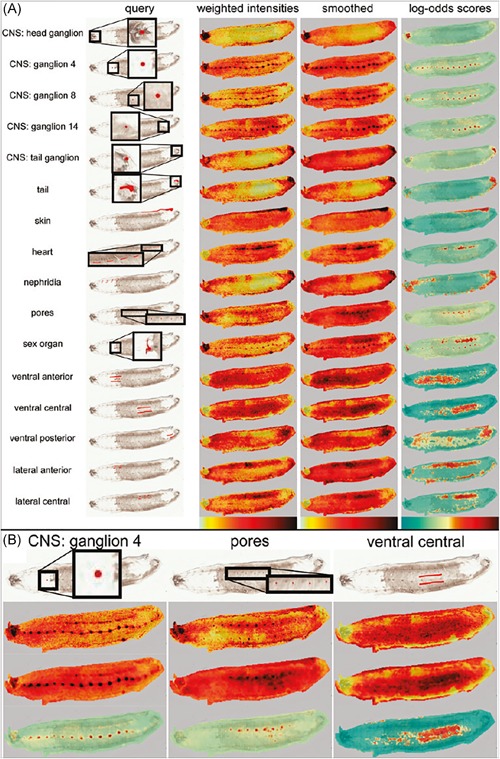
Figure 15.

Example of AMASS. Original caption: (a) List of queries and their associated results. Shown on each row are the original query, the corresponding weighted intensities image, the smoothed weighted intensities image, and the log‐odds scores image. Querying with specific image segments results in the recruitment of other spots with similar molecular signatures. For example, querying with one ganglion or a few pores recruits the whole CNS or the rest of the pores, respectively. (b) Detailed images for 3 different queries. We can see that while smoothing helps in cleaning noise on larger queries such as the ventral query, it also can cause the loss of some MALDI spots in the case of smaller regions, such as the pores. Source: Reprinted with permission from Bruand et al., 2011a, Figure 2. Copyright 2011 American Chemical Society. AMASS, algorithm for MSI analysis by semisupervised segmentation. [Color figure can be viewed at wileyonlinelibrary.com]
