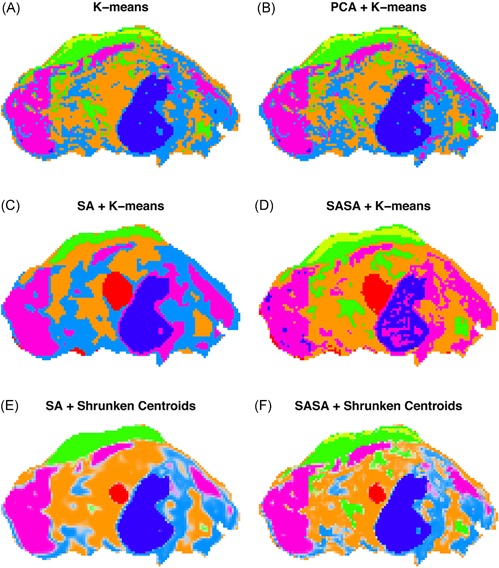
Figure 16.

Example of spatial shrunken centroids clustering. Original caption: Pig fetus cross‐section: segmentation comparison. (a) ‐means clustering applied to the peak‐picked spectra. (b) ‐means clustering applied to the first five principal components of the peak‐picked spectra. (c) Spatially aware (SA) clustering. (d) Spatially aware structurally adaptive (SASA) clustering. (e) Spatial shrunken centroids with SA distance. (f) Spatial shrunken centroids with SASA distance.
Source: Reproduced from Bemis et al., 2016, Figure 3, under CC‐BY License. [Color figure can be viewed at wileyonlinelibrary.com]
