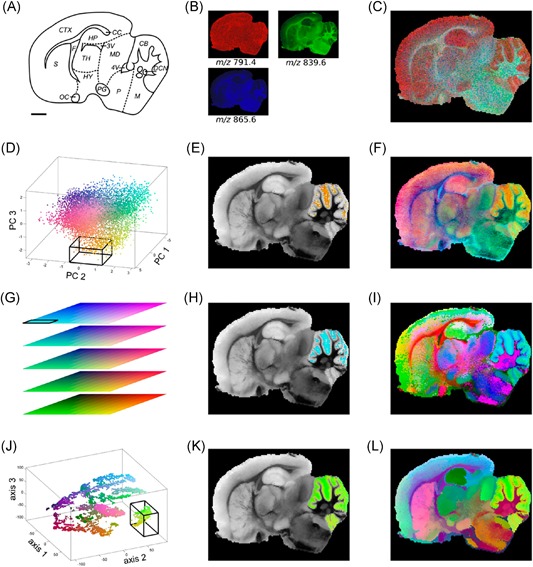
Figure 18.

Example of t‐SNE applied to MALDI IMS data. Original caption: RGB color‐coding of hyperspectral modeling results. (a) Schematic of the anatomy for the rat brain that was subjected to MALDI MSI after formalin fixation; scale bar = 2 mm. CB, cerebellum; CC, corpus callosum; CTX, cerebral cortex; DCN, deep cerebellar nuclei; F, fornix; HP, hippocampus; HY, hypothalamus; M, medulla; MD, midbrain; OC, optic chiasm; P, pons; PG, pituitary gland; S, septum; TH, thalamus; 3V, third ventricle; 4V, fourth ventricle. (b) Three randomly chosen single m/z images (m/z791.4, 839.6, and 865.6). (c) An overlay of the three images in b is shown, through combining the individual red, green, and blue intensities for each pixel as additive colors (white pixels consist of high levels of red, green, and blue). (d) PCA space: the location of a pixel (each pixel is represented by a dot) on principal component 1 (PC 1), PC 2 and PC 3 determines the intensity for red, green and blue (RGB), respectively. (e) The pixels contained in the box in the PCA scores plot in d are shown in color. (f) The image after color‐coding the pixels with the RGB‐scheme shown in d. (g) SOM space: a unique color for each SOM unit is assigned with red, green, and blue representing the location along the three dimensions of the 3D SOM map (20 × 10 × 5). (h) The pixels that were mapped in the square 3 × 3 × 1 section of the SOMmap highlighted in g can be seen in the original image with the same color‐coding. (i) The complete image with SOM‐based RGB color‐coding. (j) t‐SNE space: the scatter plot of pixels in the t‐SNE model shows clear clustering patterns, and pixels are RGB color‐coded based on their positions on the three axes. (k) The cluster selected with the box in j is shown as colored pixels in the image. (l) The image after color‐coding the pixels with RGB values determined by the t‐SNE manifold learning method. Source: Reprinted with permission from Fonville et al., 2013, Figure 2. Copyright 2013 American Chemical Society. IMS, imaging mass spectrometry; MALDI, matrix‐assisted laser desorption/ionization; t‐SNE, t‐distributed stochastic neighborhood embedding. [Color figure can be viewed at wileyonlinelibrary.com]
