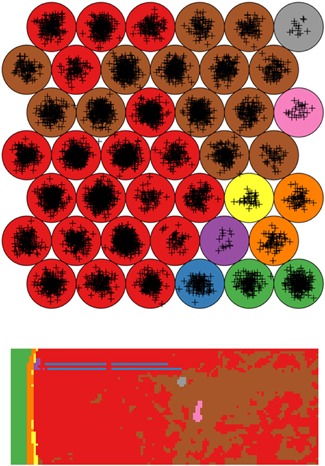
Figure 19.

Example of a SOM in MALDI IMS. Original caption: Results of the SOM mapping of the apple dataset. The lattice is the 2D representation of the SOM. Each plus is a pixel. The nine different colors highlight the result of the hierarchical clustering on the codebook vectors. Bottom panel: output of the segmentation process. The color of each pixel is selected on the base of the SOM unit it is mapped to. Source: Franceschi and Wehrens (2014), Figure 2, reproduced with permission from John Wiley & Sons. IMS, imaging mass spectrometry; MALDI, matrix‐assisted laser desorption/ionization; SOM, self‐organizing map. [Color figure can be viewed at wileyonlinelibrary.com]
