
Figure 4.
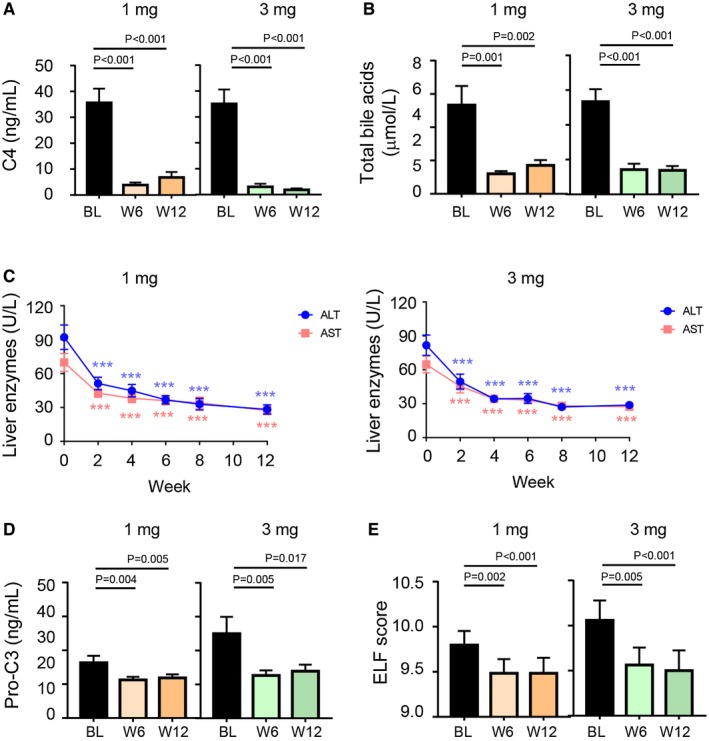
Serum outcome measures. (A) Concentrations of C4 at baseline, week 6, and week 12. (B) Levels of total bile acids at baseline, week 6, and week 12. (C) ALT and AST over time. (D) Concentrations of Pro‐C3 at baseline, week 6, and week 12. (E) ELF scores at baseline, week 6, and week 12. Shown are mean ± SEM; *** P < 0.001 versus baseline; P values by one‐sample t test. Abbreviations: BL, baseline; W, week.