
Figure 1.
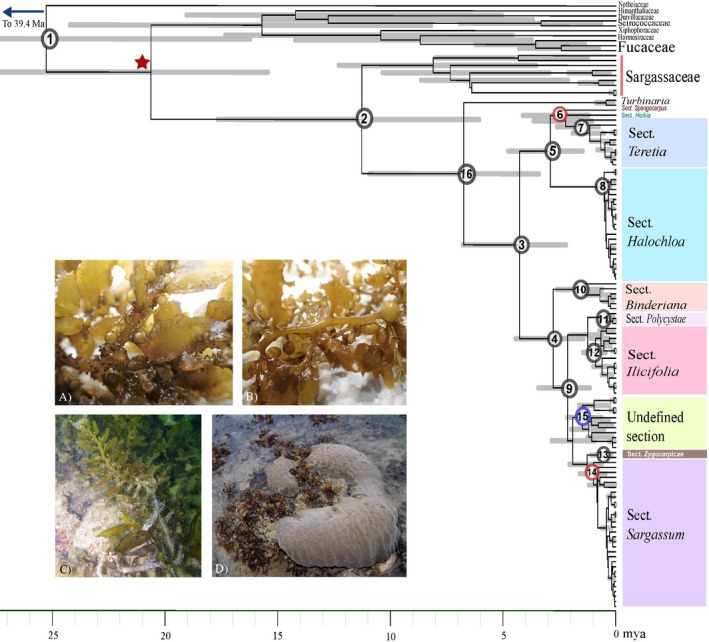
Maximum clade credibility chronogram from the BEAST analysis. Gray bars represent 95% highest posterior density (HPD) intervals of node ages. The calibrated node is denoted by a red star. Posterior probabilities of the numbered nodes (see Table 1) are denoted by color: PP > 95: black; 95 ≤ PP < 90: red; PP ≤ 90: blue. Each colored box on the right represents a section within subgenus Sargassum. The inset shows: A) Sargassum polycystum; B) Sargassum sp.; C) S. swartzii (photo credit: J.K.Y. Low); and D) coral‐Sargassum interaction (photo credit: J. Fong).