
Figure 2.
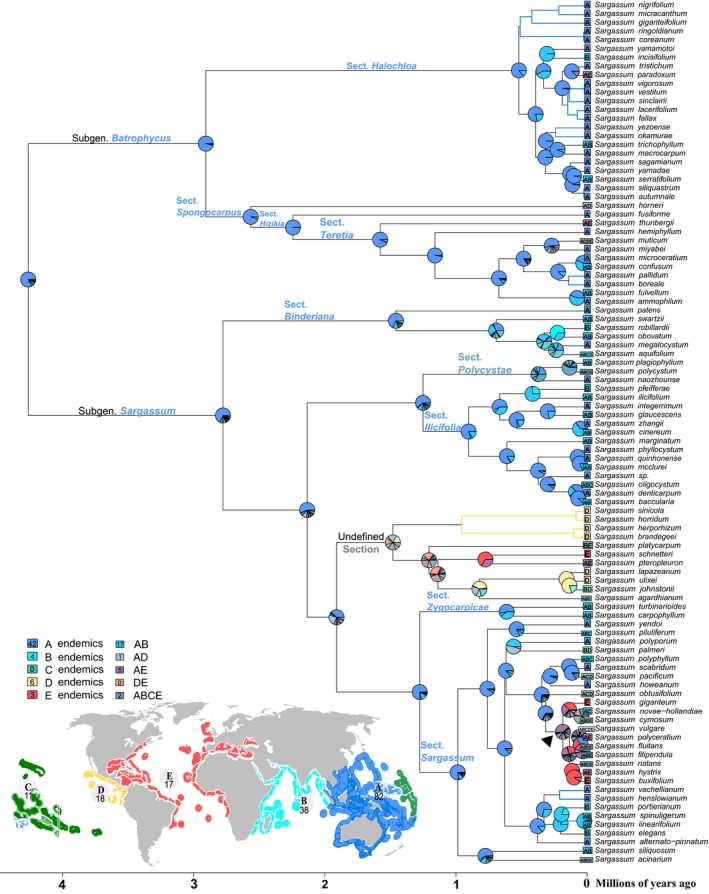
Ancestral range estimation of Sargassum species under the DEC + J model fitted onto a time‐calibrated phylogeny (Fig. 1). Tip symbols represent contemporary geographic ranges of extant taxa, and the nodal pie diagrams reflect ancestral ranges of the common ancestor. Colored taxonomic groups correspond to their ancestral range of the highest probability, and colored branches indicate maximal probability of single area distribution. Marine areas used in the analysis are Central Indo‐Pacific (A), Western Indo‐Pacific (B), Eastern Indo‐Pacific (C), Tropical Eastern Pacific (D), and Atlantic (E).