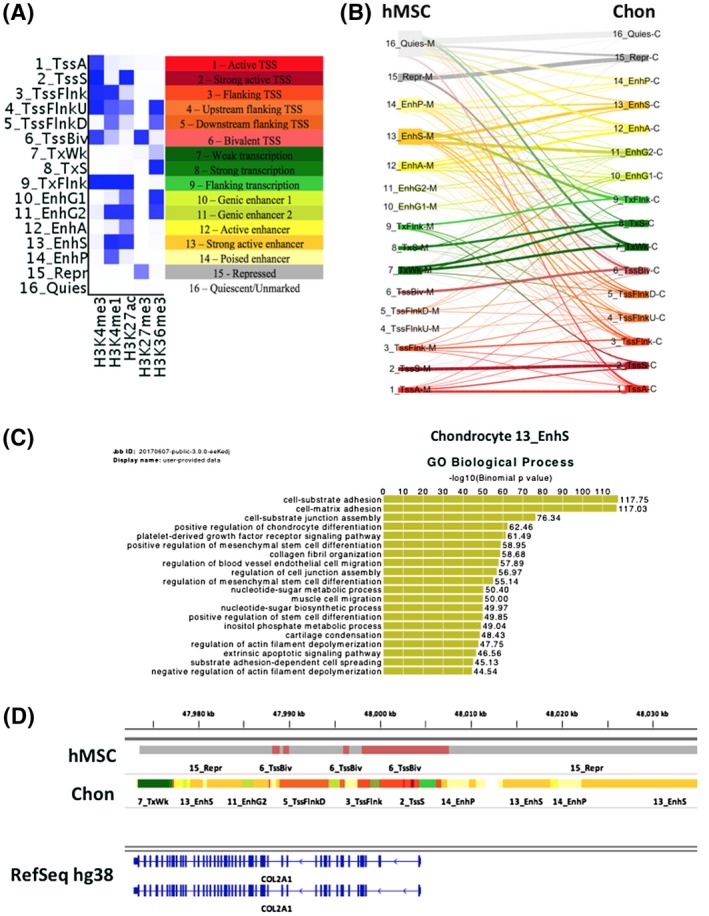
Figure 2.

A 16 chromatin state model generated from hMSC and differentiated chondrocyte histone ChIP‐seq. A, Chromatin state model with annotated states. The chromatin state model was generated using the ChromHMM tool with all hMSC and differentiated chondrocyte data using input controls. Intensity of blue within the heatmap represents the model emission probabilities (Table S4). B, Genome‐wide changes in chromatin states during hMSC chondrogenesis. The thickness of the lines represents the frequency of chromatin state changes from hMSC to chondrocytes (Figure S2). C, GREAT biological process GO terms for the chondrocyte strong enhancer (13_EnhS) state. Genome coordinates of the 13_EnhS were used as input into the GREAT tool which associates cis‐regulatory elements with genes. D, IGV genome browser view of hMSC and chondrocyte chromatin states around the COL2A1 gene. Colors for the ChromHMM defined chromatin states are as in panel A
