Figure 5.

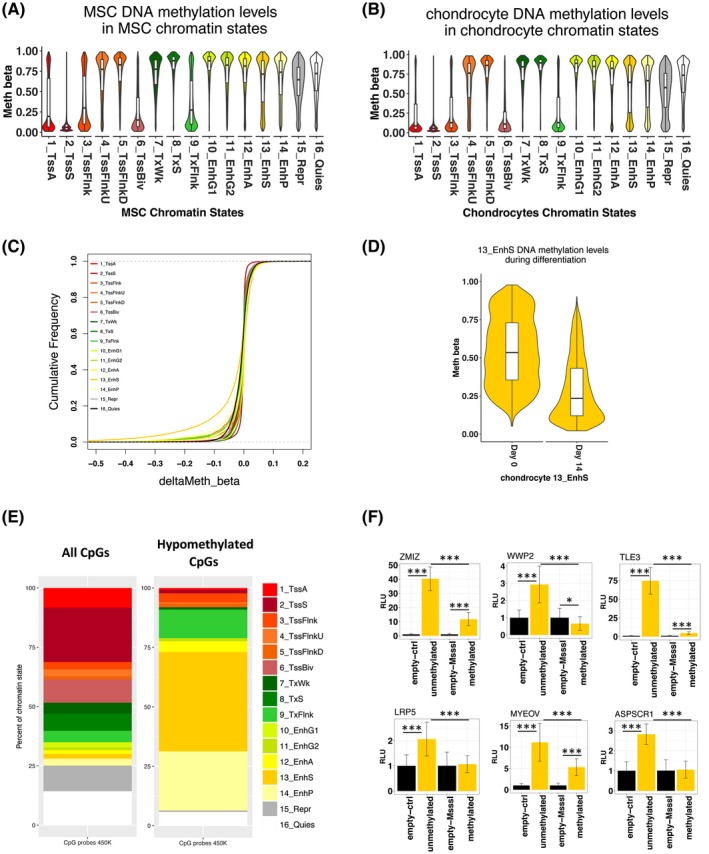
DNA methylation in chondrocyte chromatin states. A,B, Methylation levels of CpGs in the hMSC and chondrocyte chromatin states, respectively. CpG genome coordinates were intersected with chromatin states using BEDTools intersect. C, Empirical cumulative frequency plot of methylation changes (beta values) in chondrocyte chromatin states during hMSC chondrogenesis. D, Significantly methylated CpGs (FDR < 0.05) in between hMSCs and chondrocytes in chondrocyte chromatin states. E, The percentage of all CpGs on the 450k array in each chondrocyte chromatin state and the percentage of de‐methylated CpGs during chondrogenesis in chondrocyte chromatin states. F, Luciferase reporter assay with enhancer regions with and without DNA methylation (n = 6). Enhancers are labeled with their nearest gene. Significance levels: (*) P‐value < .05, (**) P‐value < .01, and (***) P‐value < .001. Error bars are ± standard deviation
