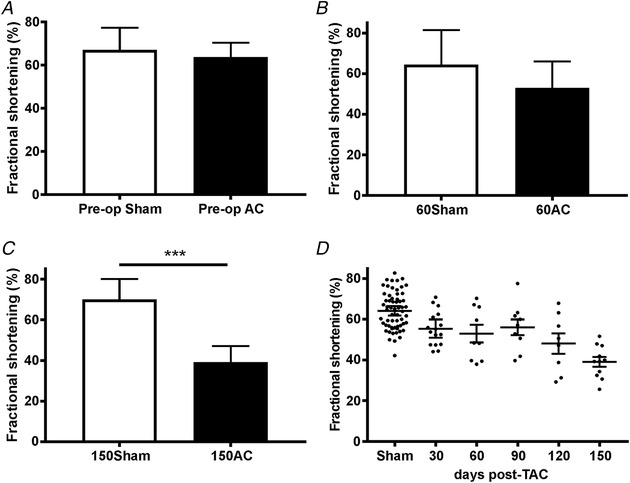
Figure 1.

The changes to fractional shortening (FS) just prior to the AC surgery (pre‐operation) (A), at 60 days post‐AC (B) and at 150 days post‐AC (C)
Number of animals (N) for Pre‐op = 19 sham, 39 AC; N for 60 day = 7 sham, 9 AC; and N for 150 day = 9 sham, 11 AC. A–C show mean (SD). C: *** P < 0.001, Student's t test. D, the decline in FS over time in the form of scatter plots in which the longer bars show mean and the shorter bars 95% CI. In this panel the sham values have been combined because there are no significant differences in FS in sham animals over time.
