Figure 2.

Comparisons of amplitudes of Ca2+ transients
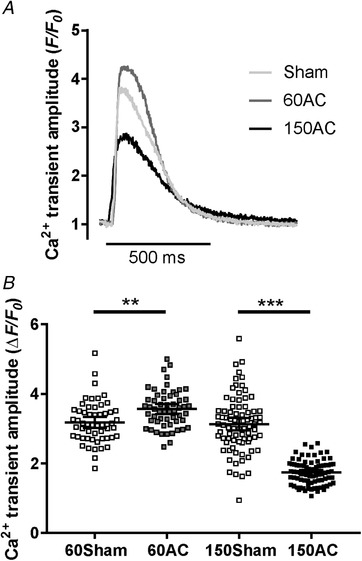
A, sample Ca2+ transients recorded from ventricular myocytes isolated from hearts 60 and 150 days after AC (60AC and 150AC, respectively) and 60 days following a sham operation (Sham). B, pooled data with 95% CI. Ca2+ transient amplitudes were 11% greater in 60AC compared with 60Sham but significantly reduced in 150AC compared with 150Sham (60Sham, n/N = 55/5; 150Sham, n/N = 81/6; 60AC, n/N = 56/5; 150AC, n/N = 84/6; one‐way ANOVA with Sidak post hoc test, ** P < 0.01, *** P < 0.001). n/N, total number of cells (n) from the total number of hearts (N).
