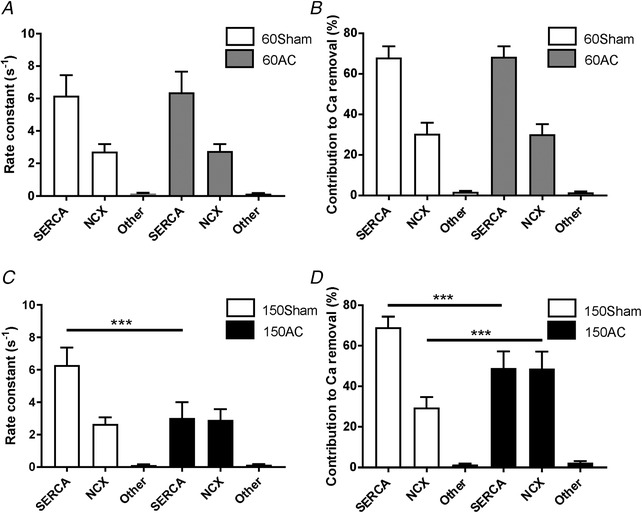
Figure 3.

Comparing the rates and relative contributions of the cytosolic Ca2+ removal mechanisms between experimental groups
A, the mean rate constants (SD) for 60 day hearts. 60Sham and 60AC had similar rate constants for SERCA, Na+/Ca2+ exchange (NCX) and other slower transporters. The corresponding contributions of the processes to relaxation are shown in B. C and D, similar measurements from 150 day hearts which show that the rate constant of SERCA is slower compared with sham. (60Sham, n/N = 55/5; 150Sham, n/N = 54/4; 60AC, n/N = 46/5; 150AC, n/N = 75/6; one‐way ANOVA with a Sidak post hoc test, *** P < 0.001.)
