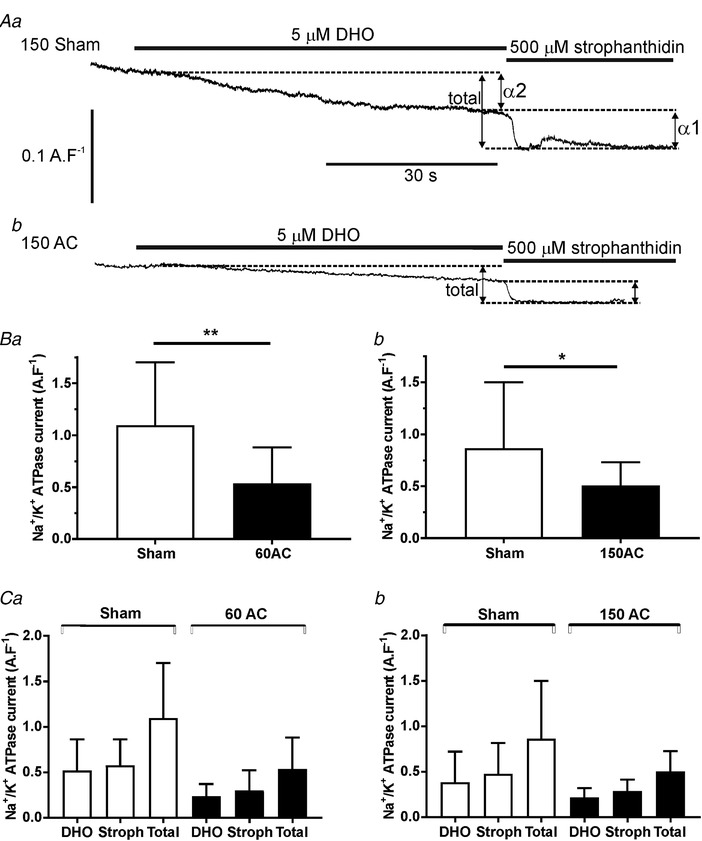
Figure 6.

Measurements of Na+, K+ ATPase currents and their isoforms by pharmacological inhibition
A, typical recordings from cells isolated from 150‐day sham (upper trace) and 150‐day post‐AC (lower trace) hearts. Dihydro‐ouabain (DHO, 5 μm) was applied to inhibit the high affinity component of the Na+/K+ (α2 isoform) and 500 μm strophanthidin was applied to produce complete inhibition of the ATPase current by inhibiting both isoforms. The individual current changes are added to produce the total current. Comparisons of the changes in total pump current between sham and AC cells are shown in B (a, 60 days post‐AC; b, 150 days post‐AC). Changes in α1‐ (stroph) and α2‐ (DHO) dependent currents after 60 and 150 days post‐AC are shown in Ca and b, respectively. Student's t test, ** P < 0.01, * P < 0.05; means (SD); n cells/N hearts for 60 days = 15/6 (sham), 13/3 (AC); n/N for 150 days = 25/6 (sham), 15/4 (AC).
