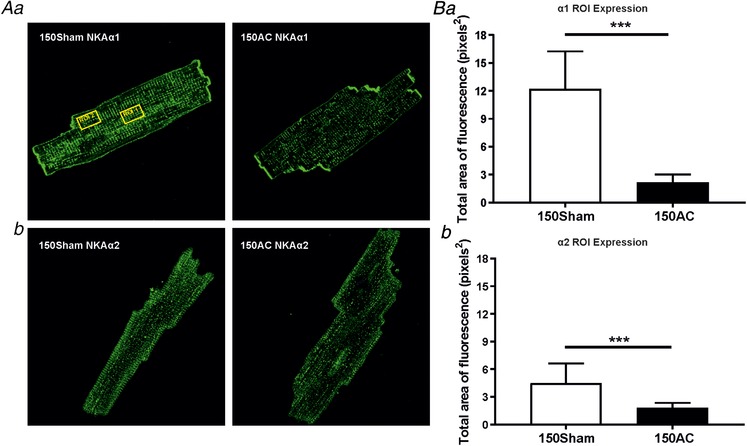
Figure 8.

Immunostaining of Na+, K+‐ATPase (NKA) isoforms α1 (Aa and Ba) and α2 (Ab and Bb)
Aa, cardiomyocyte staining of Na+,K+‐ATPase α1 in Sham and 150‐day post‐AC cells. Visibly reduced staining in AC cell compared to Sham. One ROI (shown by yellow rectangle 24 × 15 μm) was placed in the centre and another near the edge of cell to measure the total area of fluorescence and the mean total area of the two ROI was calculated. b, Na+,K+‐ATPase α2 immunolabelling in Sham and AC cells. Ba, total area of fluorescence of Na+,K+‐ATPase α1 markedly declines between Sham and AC. b, the total area of fluorescence of Na+,K+‐ATPase α2 is significantly reduced between age‐matched Sham and AC groups. *** P < 0.001. Sham n = 22 and 150AC n = 46 for NKAα1, Sham n = 49 and 150AC n = 30 for NKAα2 from two hearts per group. Mean (SD).
