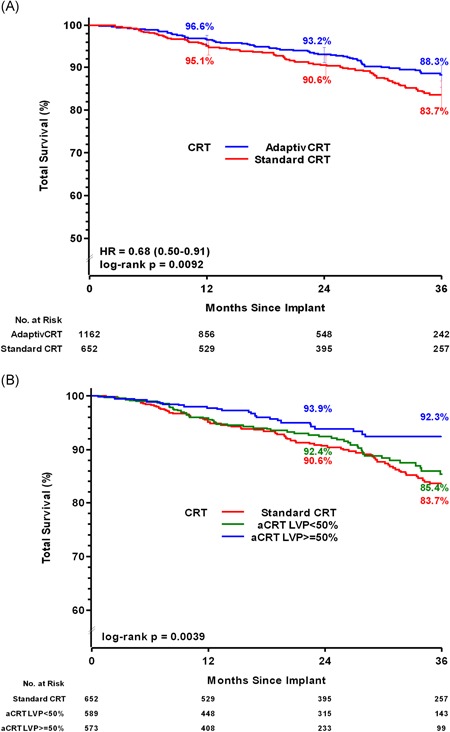
Figure 1.

A, Patient Survival for aCRT vs standard CRT. Curves reflect unadjusted Kaplan‐Meier estimates of cumulative survival probability in patients programmed to aCRT (blue line) and standard CRT (red line) through 36 months follow‐up. Unadjusted hazard ratio derived from data through 36 months for each cohort using Frailty survival regression models. B, Patient survival stratified by percent LV pacing (LVP). Curves reflect unadjusted Kaplan‐Meier estimates of cumulative survival probability among aCRT patients and standard CRT patients (red line). aCRT patients were stratified by percent LV pacing (≥50% [blue line] and less than 50% [green line]). CRT, cardiac resynchronization therapy; HR, hazard ratio; LV, left ventricular
