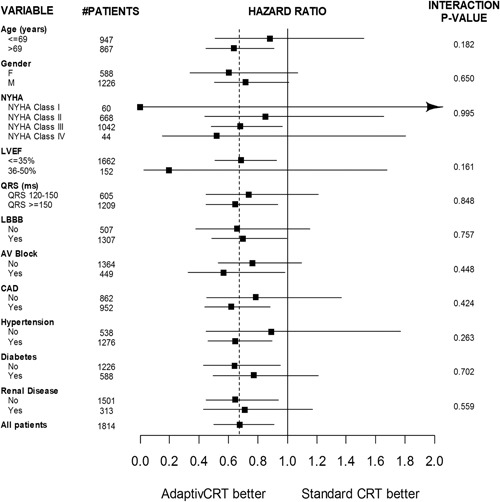
Figure 2.

Mortality subgroup analysis hazard ratio forest plot. Risk of mortality through 36 months postimplant comparing aCRT and standard CRT. The vertical solid line corresponds to equal risk. The vertical dashed line represents the hazard ratio from the full comparison. The horizontal solid lines represent the 95% confidence intervals for the hazard ratios. AV, atrioventricular; CAD, coronary artery disease; CRT, cardiac resynchronization therapy; LBBB, left bundle branch block; LVEF, left ventricular ejection fraction; LVP, left ventricular pacing; NYHA, New York Heart Association
