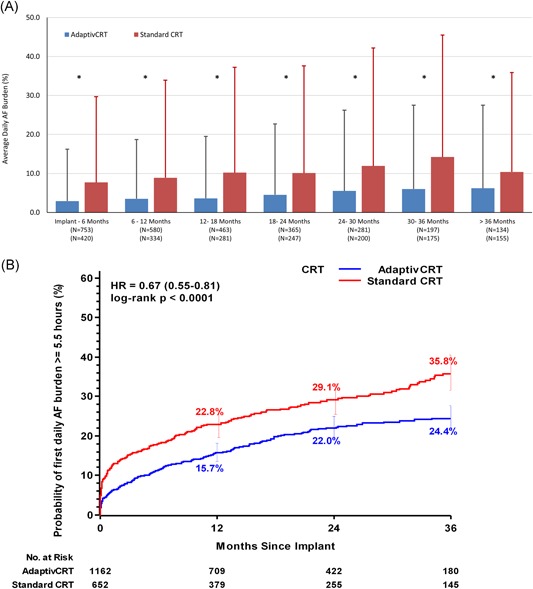
Figure 3.

A, Daily AF burden summary. Average daily AF burden summary in 6‐month time periods comparing aCRT (blue bars) with standard CRT (red bars). Error bars reflect the standard deviation. B, Incidence of AF burden of 5.5 hours or longer. Curves reflect unadjusted Kaplan‐Meier estimates of cumulative incidence of developing daily AF burden of 5.5 hours or longer in patients programmed to aCRT (blue line) and standard CRT (red line) through 36‐month follow‐up. Unadjusted hazard ratio derived from data through 36 months for each cohort using Frailty survival regression models. AF, atrial fibrillation; CRT, cardiac resynchronization therapy; HR, hazard ratio. *P < .05, t test
