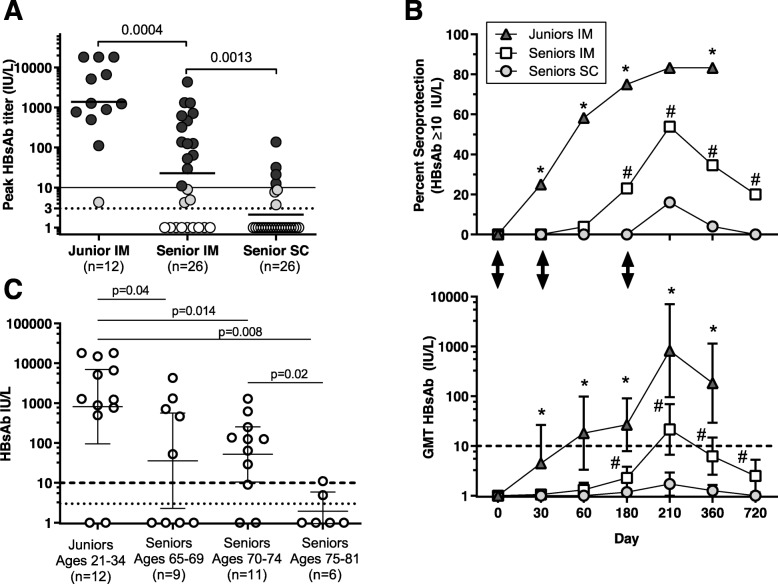
Fig. 1.
Anti-HBs serum Ab (HBsAb) in volunteers inoculated with Hepatitis B vaccine via IM (Juniors and Seniors) and SC (Seniors) routes. a. Peak antibody responses (GMT) are shown in each group. Seroconverters (> 3 IU/L) are shown as light gray filled circles, and seroprotected shown as solid circles. Significant differences between groups were determined by WMW tests. For statistical calculations of GMT, HBsAb values of < 3 IU/L are scored as 1 IU/L. b. Kinetics of HBsAb response to Hepatitis B vaccine in Junior and Senior volunteers inoculated via different routes. Upper panel: Percent of seroprotected volunteers (HBsAb ≥ 10 IU/L), with vaccination days indicated by arrows. Lower panel: GMT HBsAb over time. For statistical calculations of GMT, HBsAb values of < 3 IU/L are scored as 1 IU/L. Data include all specimens available for each time point: Juniors IM; n = 12, days 0–360. Seniors IM: n = 26, days 0–360; n = 25, day 720. Seniors SC: n = 26, days 0–180; n = 25, days 210 and 360; n = 22, day 720. The dashed line indicates the threshold for a protective response (10 IU/L). Significant differences by WMW test of area under the curve (AUC): p = 0.0007 Juniors IM vs. Seniors IM; p = 0.001 Seniors IM vs. Seniors SC. c. HBsAb titers at day 210 show reductions in seroresponses with increasing age. The heavy dashed line indicates the threshold for a protective response (10 IU/L); the light dashed line indicates the threshold for any response (≥ 3 IU/L). The geometric mean values and 95% confidence intervals for each group are shown. Significant differences between groups are shown (Wilcoxon-Mann-Whitney -WMW- test), nonsignificant differences are not shown. 10 of 12 Juniors (83%) achieved seroprotection at this timepoint, compared to 5 of 9 (55%) of Seniors ages 65–69, 8 of 11 (73%) Seniors ages 70–74, and 1 of 6 (17%) Seniors ages 75–81

