Fig. 2.
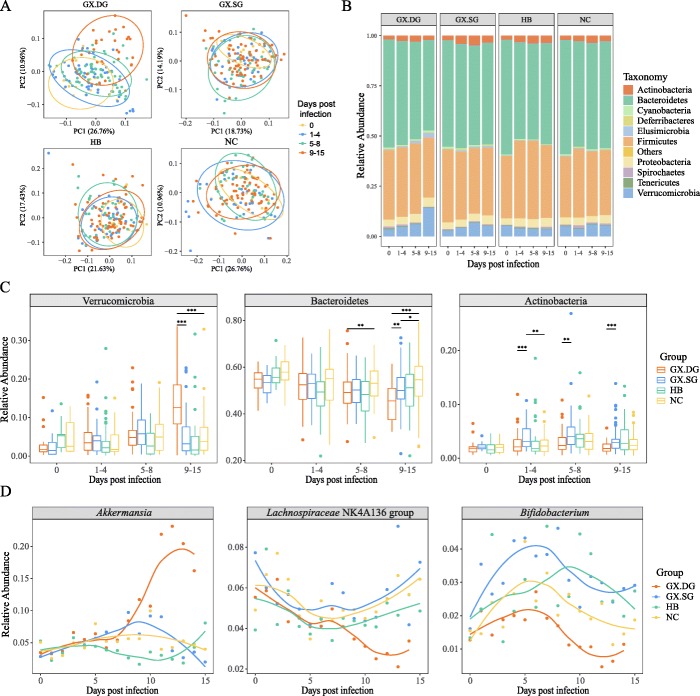
The influenza virus infection alters the gut microbiota to various extent in individual mice. The fecal samples were collected on days 0–15 post-infection in the experiment shown in Fig. 1a, b. Based on survivability, the GX-infected mice were divided into a group that survived the infection (GX.SG) and a group that succumbed to the infection (GX.DG). All fecal samples were also divided into the corresponding groups. The GX.DG, GX.SG, NC, and HB groups contained 156, 160, 160, and 160 fecal samples for 16S rRNA gene sequencing analysis, respectively. a PCoA of the weighted UniFrac distances among the GX.DG, GX.SG, HB, and NC groups. b Relative abundances of bacterial phyla in the GX.DG, GX.SG, HB, and NC groups. c Bacterial phyla showing significant differences in abundance (*P < 0.05, **P < 0.01, ***P < 0.001, Wilcoxon-Mann-Whitney test). To more intuitively analyze the data (a–c), samples from the 16 time points were grouped into four infection stages: stage 1 (day 0), control; stage 2 (days 1–4), the stable weight stage; stage 3 (days 5–8), the weight loss stage; and stage 4 (days 9–15), the death stage. d Trends of the abundance changes of several bacteria at the genus level

