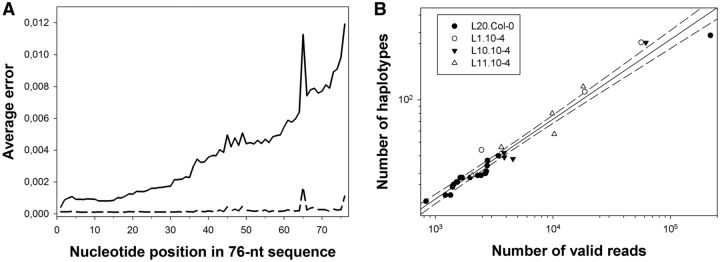
Fig. 1.
(A) Average errors per nucleotide in the 76-nt reads, computed with base qualities. The average error increased greatly toward the ends of the reads (solid line). The dashed line shows the average error after filtering. Positions 37–57 within the reads correspond to the 21-nt amiR159-HCPro target. (B) Relationship between the number of valid reads (R) per sample and the number of different haplotypes (H) detected in a sample. The solid line represents the fit to the power model H = 0.391 R0.567 (R2 = 0.962, F1,30 = 749.420, P < 0.001). The dashed lines correspond to the 95% confidence interval of the model.

