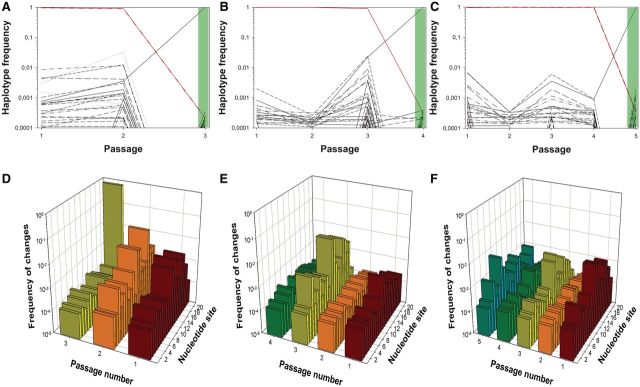
Fig. 3.
Diversity evolution in three TuMV lineages evolved in partially resistant A. thaliana 10-4 plants. (A–C) Evolution of frequency for up to the 50 more abundant haplotypes detected for the amiR target sequence along the evolution experiments. At the final positive pathogenicity test passages (3, 4, and 5), we show the haplotypic composition (shadow in light green). (D–F) Observed diversity per each of the 21 nt in the amiR target at each passage. Panels (A and D) correspond to lineage L1.10-4, panels (B and E) to lineage L10.10-4, and panels (C and F) to lineage L11.10-4. Diversity at the last indicated passage corresponds to that observed in the population that broke the 12-4 resistance (shadow in light green). Abscises axes are in decimal log scale.

