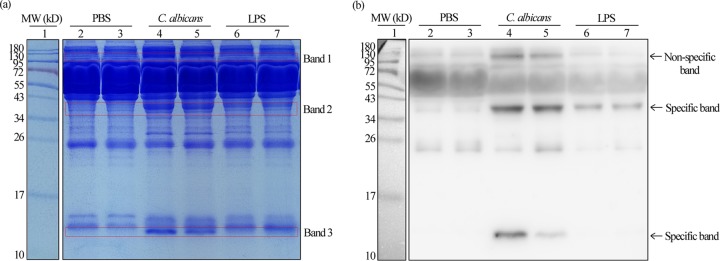
FIG 1.
Expression of mSAA1 in serum samples of mice treated with PBS or LPS or infected with C. albicans cells. (a) Coomassie brilliant blue-stained SDS-PAGE analysis. (b) Western blot analysis. Lane 1, markers; lanes 2 and 3, serum samples from mice treated with PBS (negative control); lanes 4 and 5, serum samples from mice infected with C. albicans cells; lanes 6 and 7, serum samples from mice treated with LPS (positive control). Three band regions (indicated by the red boxes) from the samples of C. albicans-infected mice were excised and used for nanoLC-MS/MS analysis (see Data Set S1 in the supplemental material for details).

