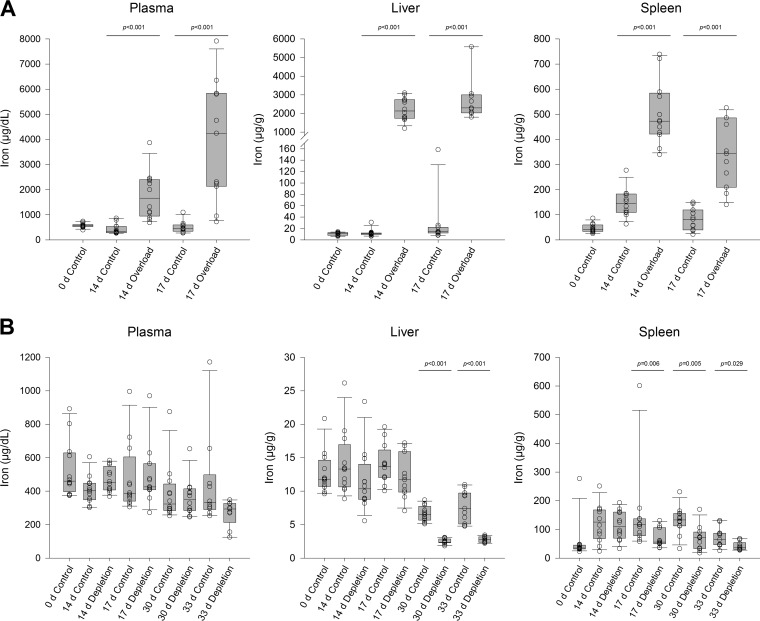
FIG 2.
Measured iron concentrations (open circles) in murine plasma, liver, and spleen tissue for iron-overloaded mice (A) and iron-depleted mice (B). Horizontal lines within boxes represent median values, while box lower and upper borders represent 1st and 3rd quartiles. Whiskers represent 10th and 90th percentiles.

