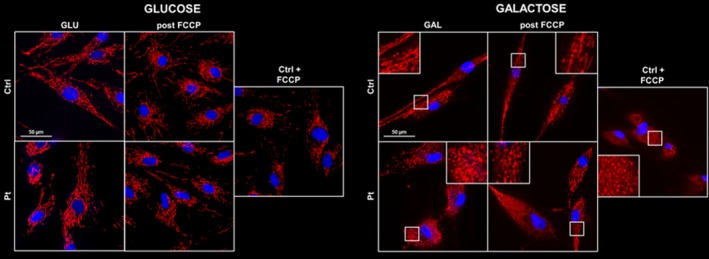
Figure 3.

Mitochondrial network analyses in patient’s skin fibroblasts. Cells were cultured in regular glucose medium (left panel) or in galactose medium (right panel). In standard growth conditions, no differences in the mitochondrial network were detected between patient and control cells (left side). When patient cells were grown under stress conditions, they were clearly unable to recover a normal mitochondrial network after FCCP treatment, showing mostly a fragmented profile (right side). Control cells treated for 4 h with 20µM FCCP were used as evidence of mitochondrial fragmentation. Hoechst 33342 staining was used to visualize cell nuclei. Images were obtained using a Nikon Ti2‐E inverted microscope at 60 × magnification. Scale bar, 50 µm.
