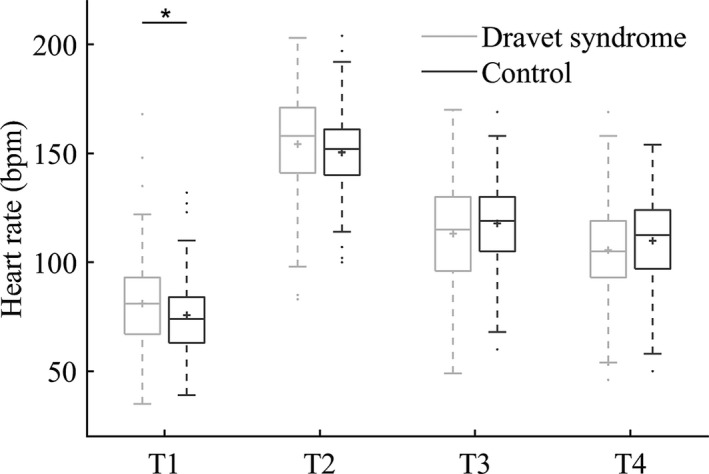
Figure 3.

Box plots of peri‐ictal heart rates in convulsive seizures of the Dravet syndrome and historical epilepsy control groups. T1 = time of seizure onset; T2 = seizure end; T3 = two minutes after T2; T4 = 5 min after T2; * significance P < 0.05. Median (solid line), mean (plus sign), interquartile interval (box), minimum, maximum (whiskers, 1.5 IQR), and suspected outliers (dots) are shown. Generalized estimating equation linear models were used to compare heart rates between the groups, correcting for within‐subject correlation and seizure onset from sleep or wakefulness.
