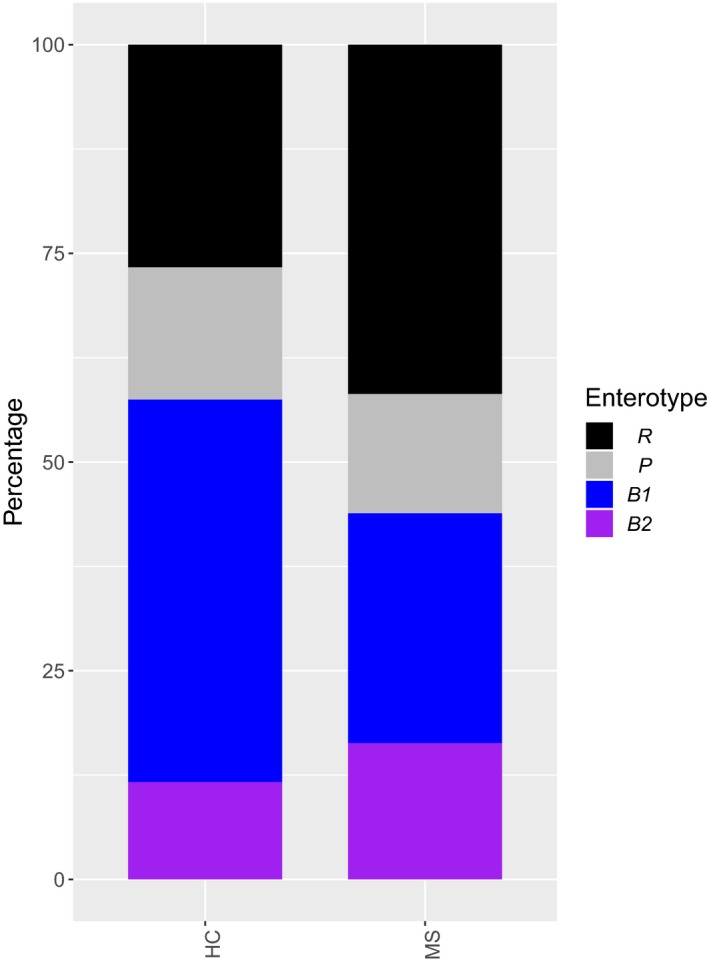
Figure 2.

Bar plot illustrating the distribution of patient and control samples (MS vs. HC) over four enterotypes: Prevotella (P, N = 33), Ruminococcaceae (R, N = 73), Bacteroides 1 (B1, N = 81), and Bacteroides 2 (B2, N = 31). FGFP, Flemish Gut Flora Project. HC, healthy controls (N = 120, including FGFP samples). MS, multiple sclerosis (N = 98). Pearson’s chi‐square test for independence, N = 218, χ 2 = 36.10, P = 0.002 with pairwise chi‐square tests.
