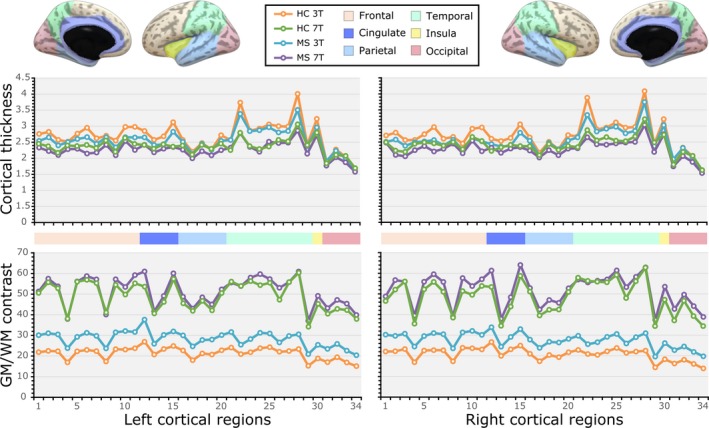
Figure 2.

Comparison of the average gray matter (GM)‐to‐white matter (WM) percent contrast (GWc) and cortical thickness (CT) across 34 regions of the left and right hemispheres between 3T‐ and 7T‐MRI data of healthy control (HC) participants and multiple sclerosis (MS) patients. The corresponding statistics for each MRI morphometric measure across cortical regions of each hemisphere are shown in supplementary Tables 1 and 2. The region numbers in the X‐axis have an exact correspondence to the regional order in supplementary Tables 1 and 2. For reference, the hemispheric regions are ordered and represented according to the lobule they form part of (frontal = beige colour; cingulate = dark blue; parietal = light blue; temporal = light green; insula = yellow; and occipital = pink).
