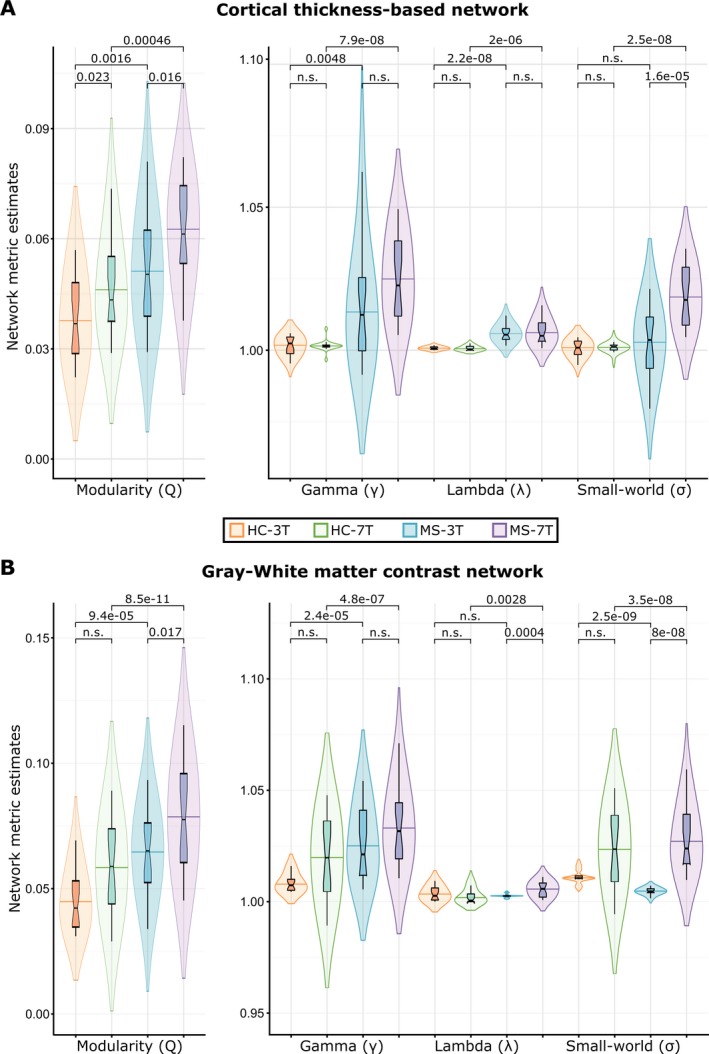
Figure 4.

Group differences in network measures: modularity (Q), normalized clustering coefficient (γ), normalized path length (λ) and small‐world (σ) of morphometric networks derived from 3 Tesla (3T)‐ and 7 Tesla (7T)‐MRI datasets of healthy controls (HC) multiple sclerosis (MS) patients for networks based on cortical thickness (A) and grey matter‐to‐white matter percent contrast (B). p‐values are corrected for multiple comparisons across groups and network parameters using FDR at 95% confidence level. In all plots groups are ordered from left to right are: HC at 3T (orange), HC at 7T (green), MS at 3T (blue), and MS at 7T (purple).
