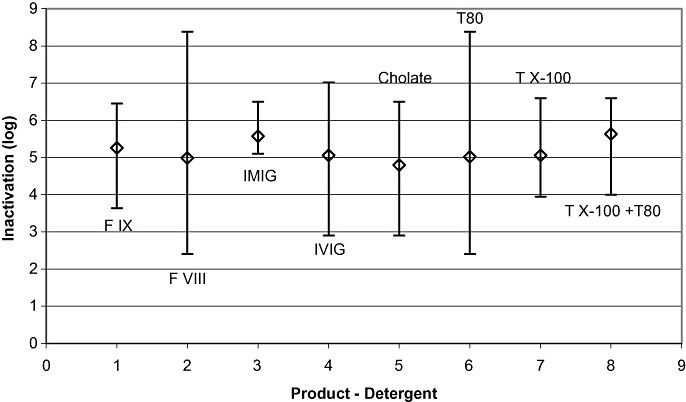
Figure 3.

Results of studies performed under production conditions (n = 128): influence of different products and procedures. Mean LRF values are plotted versus the first time point at which virus inactivation to below the limit of detection or the highest reduction factor was achieved. Shown are the mean values of inactivation and the ranges of inactivation for the four different products, F IX (n = 16), FVIII (n = 34), IMIG (n = 9), and IVIG (n = 69), and the four different combinations of TNBP with cholate (n = 21), Tween 80 (T80; n = 74), Triton X‐100 (TX‐100; n = 8), and Triton X‐100 plus Tween 80 (TX‐100 + T80; n = 25). For viruses tested, please see text. Vertical bars show the range of inactivation.
