
Figure 3. The Influence of Image Composition on Boundary Transformation.
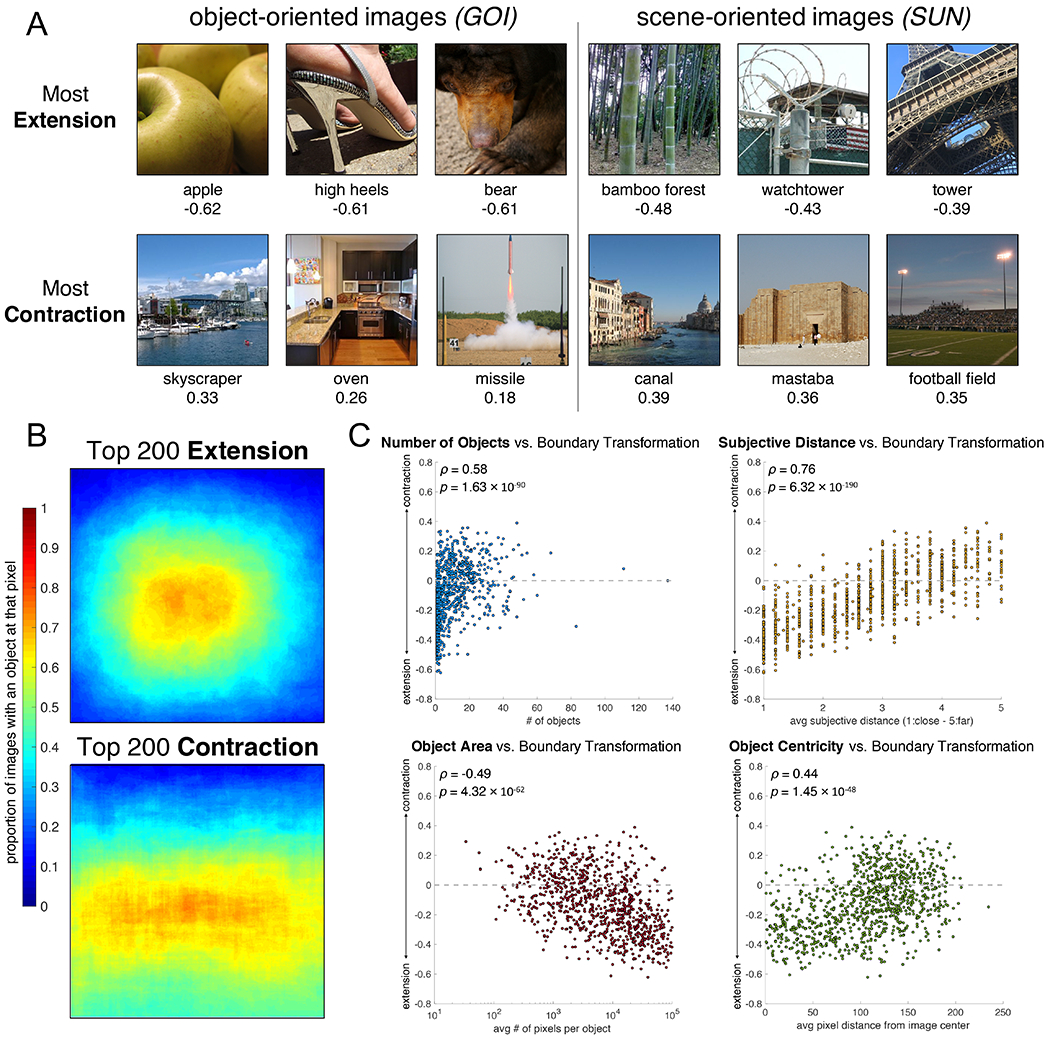
(A) The images from the 1,000 image set showing the highest boundary extension and contraction, split by database. Across databases, the images causing the most extension are images with few objects at a very close subjective distance from the observer, while those causing the most contraction tend to be wide images of scenes. (B) The location of objects within the images that show boundary extension and contraction. Each pixel is colored by the proportion of images with an object at that pixel. Extending images tend to have a centrally-located object while contracting images tend to have a spread of objects along the lower visual field. (C) Scatterplots showing the relationship between average boundary transformation rating and number of objects in the image, subjective ratings of distance to the main object (1=close to 5=far), average object area (total number of pixels) per image, and average object distance from the image center (pixels). Images that elicit more boundary extension have fewer, larger, centrally located, subjectively close objects, while images that elicit more boundary contraction have several, smaller, dispersed, far objects. These results show that direction of boundary transformation is highly related to image composition, and that more traditional scenes cause more boundary contraction.