
Figure 11:
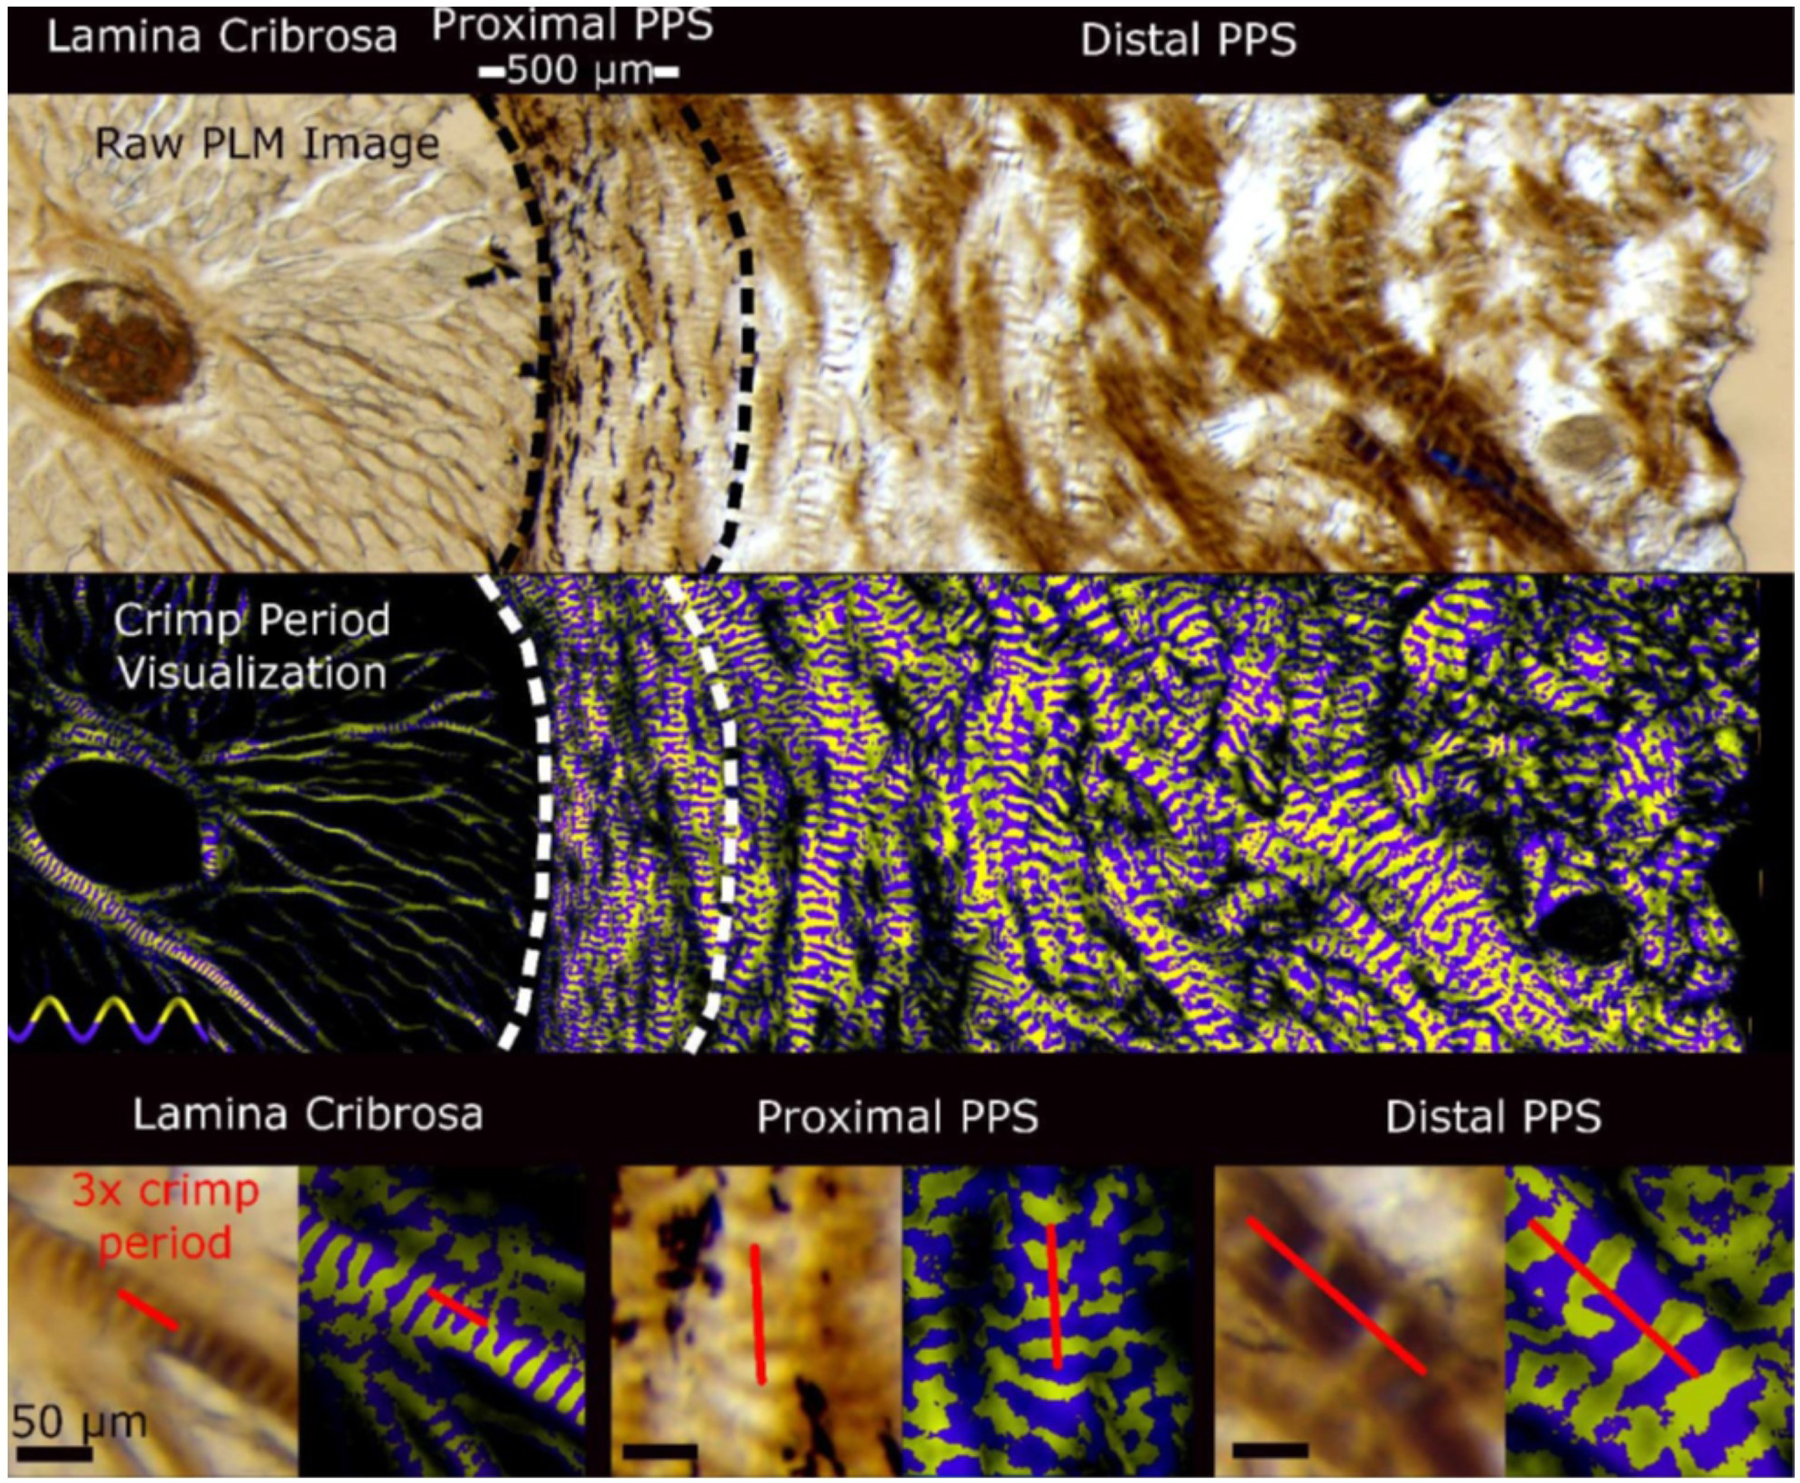
Wide views spanning the LC and sclera under PLM (top) and visualised using the yellow and purple bands as described in Fig 10 to simplify discerning crimp period independent of the orientation (middle). The bottom shows pairs of raw PLM images and corresponding crimp period visualization images of close-ups of the LC (bottom left), proximal PPS (bottom center), and distal PPS (bottom right). An example line illustrating three periods is overlaid on each. It is easy to distinguish that the crimp period in the LC was small. In the proximal PPS the period was similar to that of the LC. The period increased with distance from the canal. Figure adapted from (Jan et al., 2017a) with permission of the Association for Research in Vision and Ophthalmology.