
Figure 15:
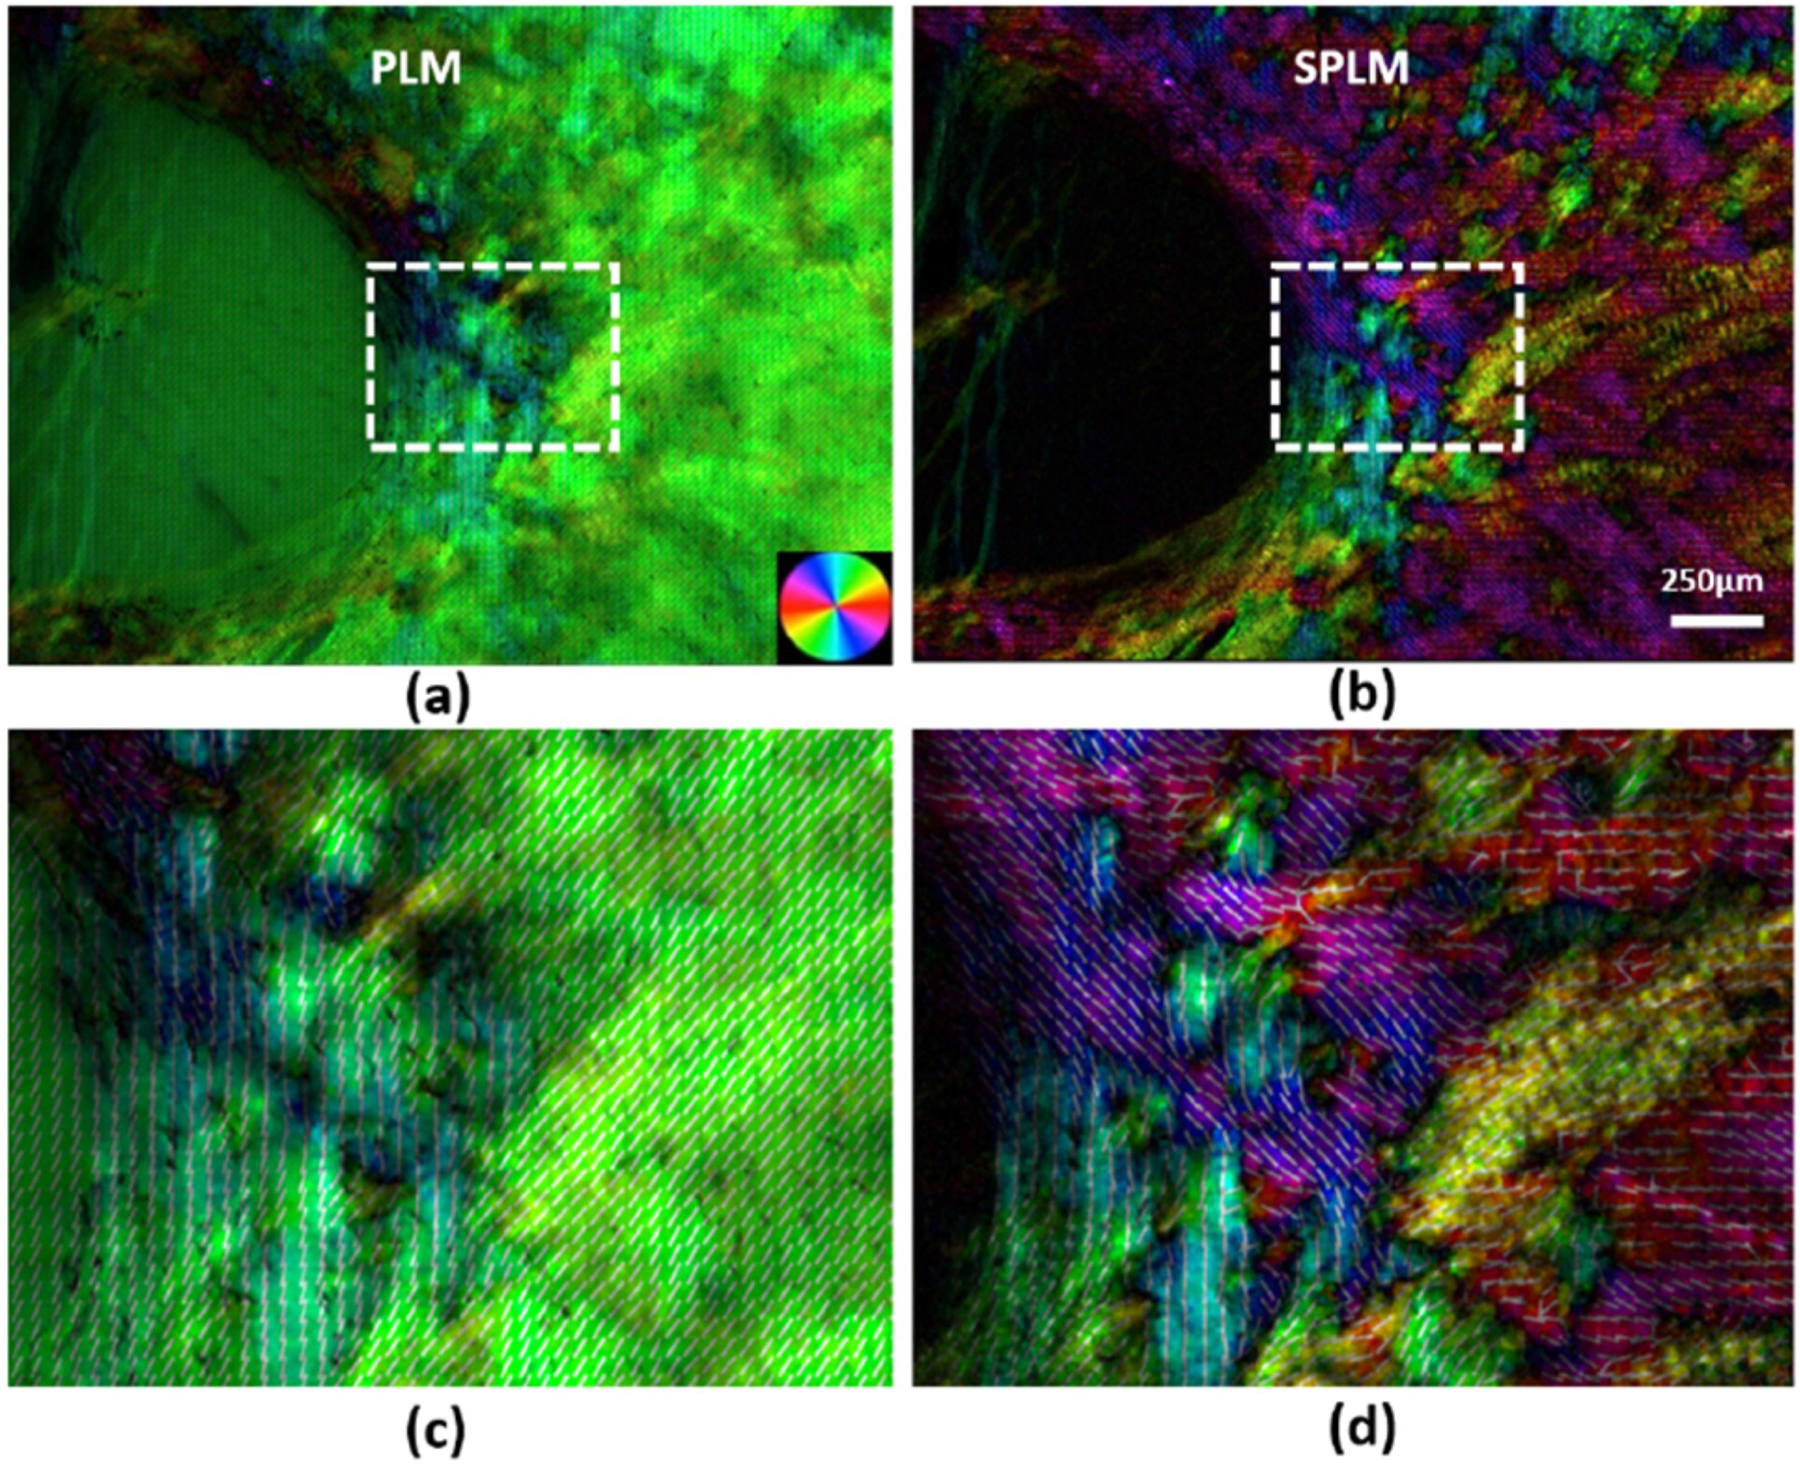
Collagen fibre orientation maps in the PPS and LC region of a pig eye. The images were acquired using either PLM (a, c) or SPLM (b, d) of an uncut thick sample. (a) The PLM images appear green, without much detail of the known architecture of the region. (b) In contrast, SPLM images show a much more heterogeneous arrangement. Both circumferential and radial fibres can be identified, based on color-coded orientations; (c) and (d) show close-ups of the region marked by the dashed rectangle. Overlaid on the images are locally averaged orientation lines. Figure adapted from (Yang et al., 2018a) with permission of the SPIE.