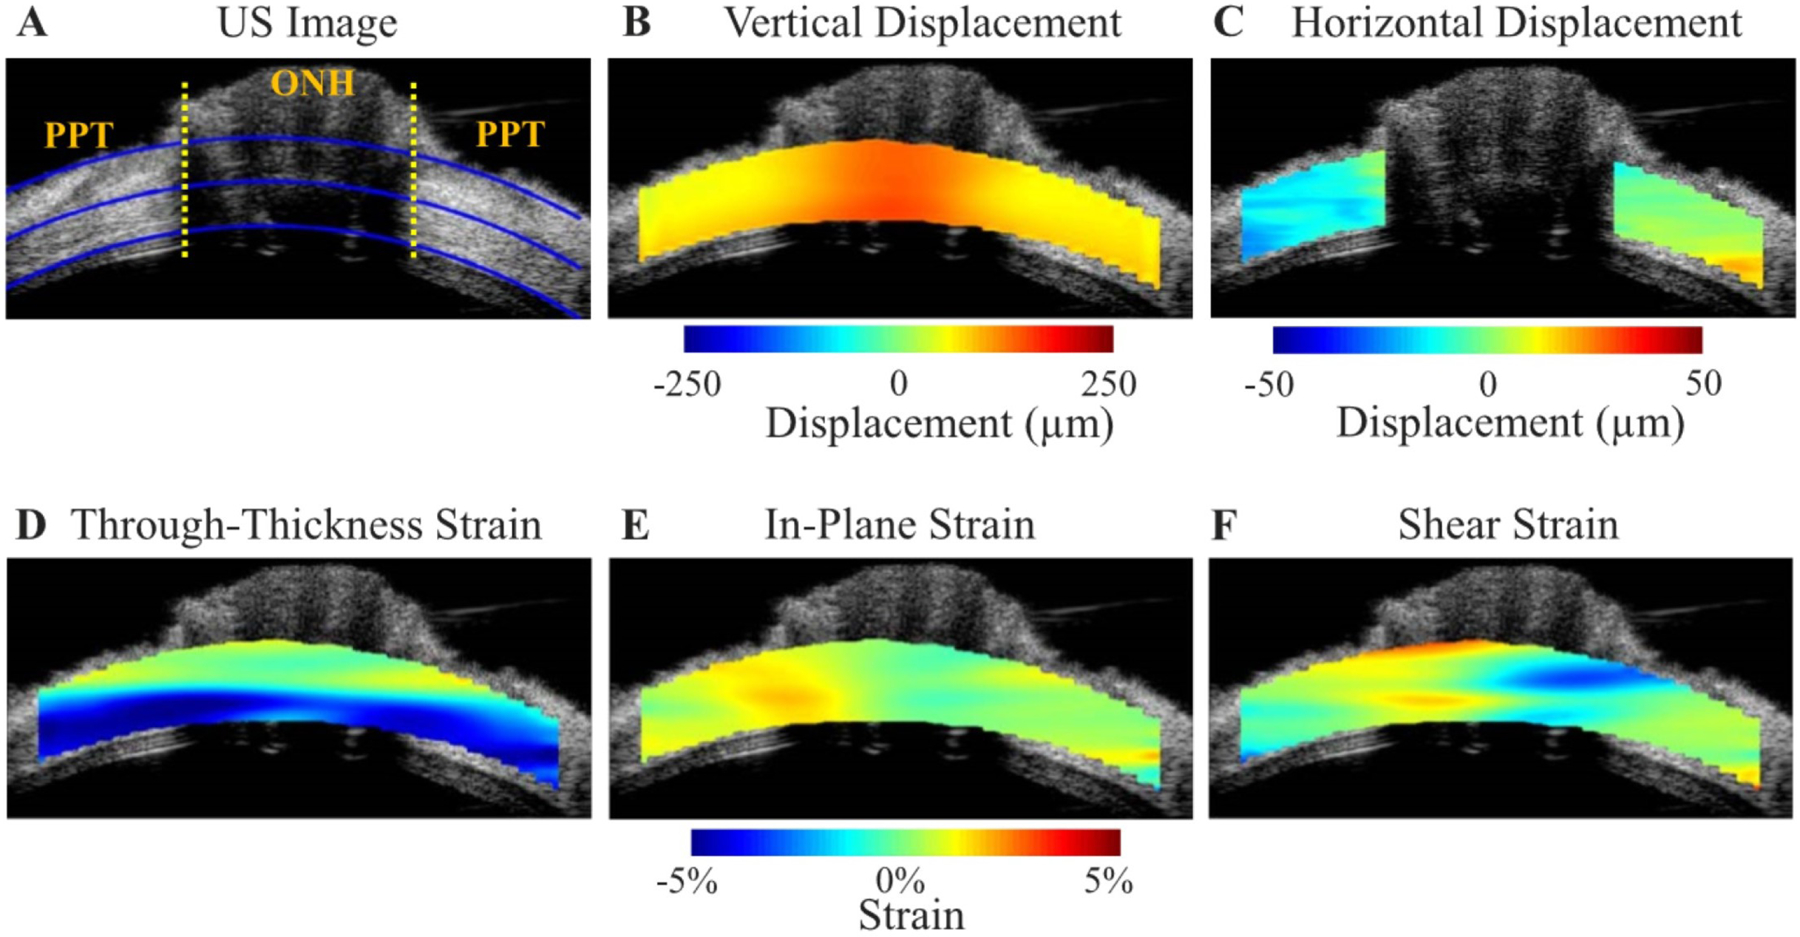
Figure 19:

Ultrasound (US) speckle tracking of scleral and ONH deformation under inflation testing. US image A) and colour maps of vertical displacement B), horizontal displacement C), and strains (D–F) for a representative human donor eye at 30 mm Hg. The yellow dotted lines in A) indicate the boundaries between ONH and peripapillary tissue (PPT), the inner and outer blue lines are fitted curves for demarcation of region of interest (ROI) for strain analysis, and the middle blue line is used to divide the anterior and posterior halves. Note that the retina is largely excluded from the ROI. Positive displacements = upward vertical movement or rightward horizontal movement. Vertical displacements were larger within the ONH. The horizontal displacement of PPT was negative on average on the left side of ONH and positive on the right side of ONH, indicating a small scleral canal expansion. Through-thickness compression was largest in magnitude and concentrated in the anterior half of the ONH and PPT. Reproduced from (Ma et al., 2019) with permission of the Association for Research in Vision and Ophthalmology.
