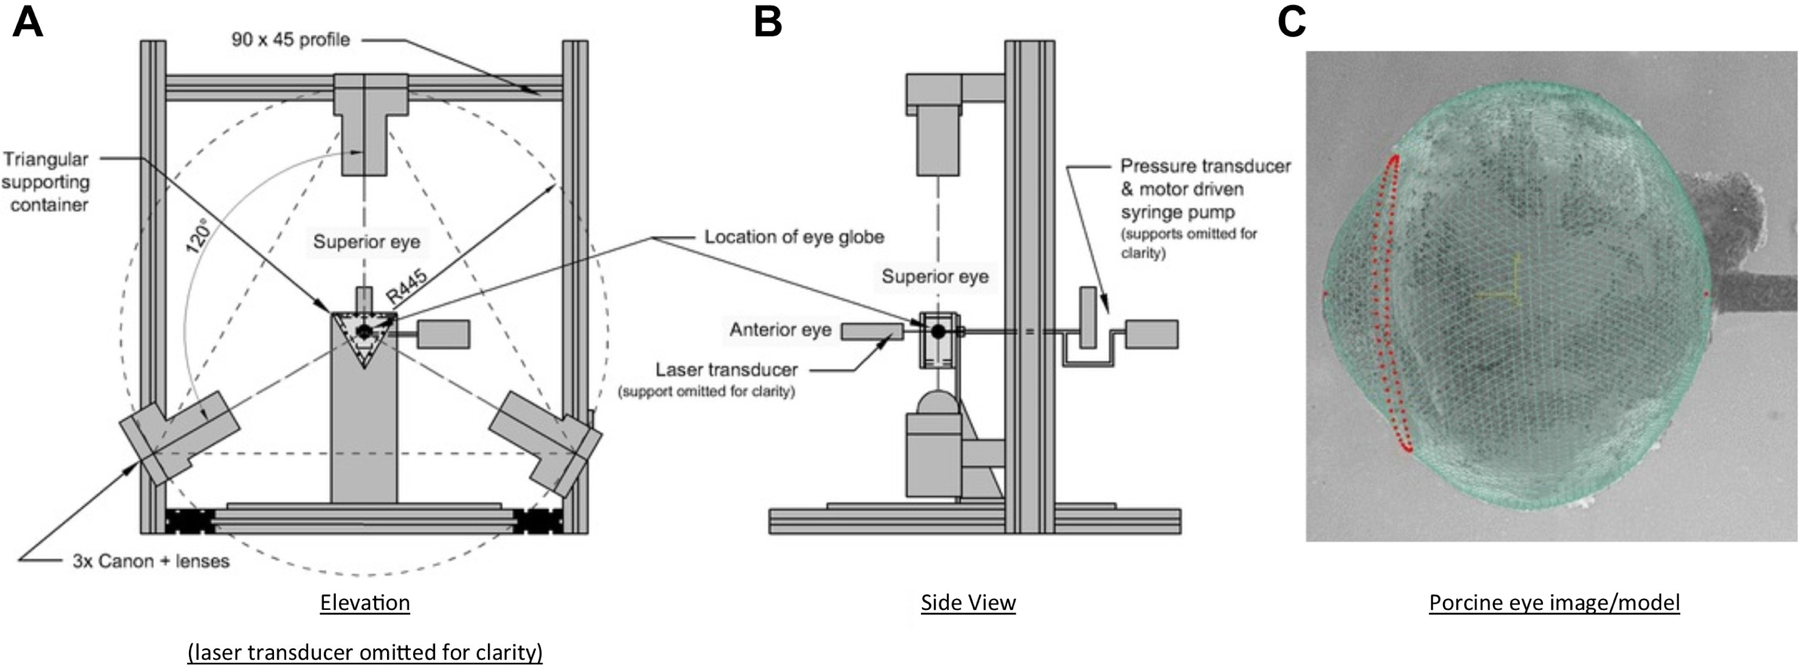
Figure 20:

Inflation testing of intact eye globe. A) Elevation view diagram of the whole eye globe inflation testing rig set-up. B) Side view of the rig set-up. C) Match between modelled and imaged topography of the eye globe. The FE nodes representing the corneal apex, posterior pole and limbal ring are highlighted in red. Adapted from (Whitford et al., 2016) under Creative Commons License 4.0.
