
Figure 7:
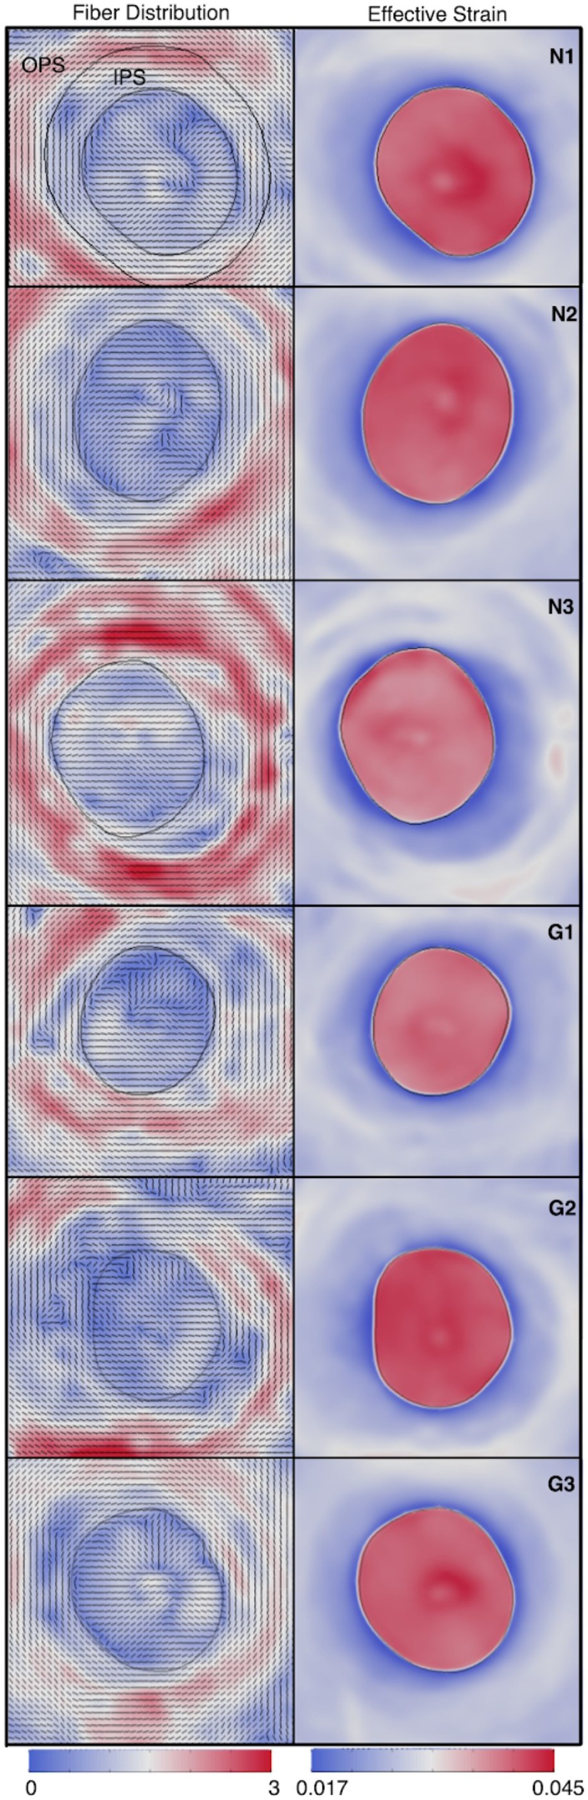
SALS mapping of fibre microstructure in the peripapillary sclera (PPS) and lamina cribrosa. Left: Fibre maps for en-face sections from 6 human donors (3 healthy: N1–3; and 3 glaucoma: G1–3). A highly aligned (red colour) fibre ring (black vector) can be observed in the PPS (the LC boundary is shown in black). Contour colour represents the fibre concentration factor. Right: Simulated IOP-induced deformations (effective strain). Low deformations (blue colour) can be observed near the scleral canal boundary (a region prone to mechanical defects). Such deformations would be much higher if one were to remove the heterogenous PPS fibre ring. OPS: outer peripapillary sclera, IPS: inner peripapillary sclera. Contour colour represents the strain magnitude. Figure modified from (Zhang et al., 2015) with permission of the Association for Research in Vision and Ophthalmology.